
Triangles can be traded by entering a position when the support or resistance line is broken and a stop-loss can be placed outside the opposite side of the formation, says By Cory Mitchell on Investopedia.com
Depending on the type of triangle present, it can have certain tendencies that may aid traders in predicting the ultimate breakout direction. When a breakout does occur, the pattern provides an entry point and stop loss for the trade. How far the breakout pattern is likely to go can be estimated by using a profit target, attained by taking a measurement from the triangle.
Using triangles in this way can provide valuable insight and an effective technical analysis tool to the trader. Indicators such as "volume" can also add further insight when trading these patterns.
Triangle Tendencies
As discussed in the other sections, while triangles are called "continuation patterns" it does not mean the appearance of a triangle pattern always indicates a continuation of the current trend. Triangles can also cause reversals. Certain triangles do have general tendencies though when seen in the context of a broader trend.
Symmetric triangles are neutral. A breakout could occur to the upside or downside. Buyers and sellers are exhibiting similar strength as the price action continually narrows towards the apex of the triangle. (Trading breakouts is unprofitable for most novice traders; consider some alternatives.)
Ascending triangles provide a slight bias for an upside breakout when the formation appears during an uptrend. The higher lows (ascending support line) indicate increasing buying pressure (or decreasing selling pressure) which may eventually overcome the strong resistance at the top of the pattern (horizontal resistance line).
Descending triangles provide a slight bias for a downside breakout when the pattern occurs during a downtrend. The lower lows (descending line) indicate selling pressure (or decreasing buying pressure) which may eventually overcome the strong support at the bottom of the pattern (horizontal line).
Ultimately, the eventual breakout direction does not need to be predicted. When a breakout does occur, a trade can be taken in the direction of the breakout.
If the trader is already in a position when a triangle forms, the position can be held while the formation continues to develop.
The position can be exited if a breakout occurs in the opposite direction of the position. This is because a breakout that occurs in the opposite direction of a position could expose the trader to a significant move against him or her, and could even indicate a full reversal of the trend depending on the size of the pattern.
Entries and Stops
When the price moves beyond the bounds of the triangle, a breakout has occurred. Breakouts can be traded as the entry, profit target, and stop level are provided by the formation. For traders already in a position, triangles can provide an estimate of how far the triangle breakout is likely to take the price.
The guidelines for entering a position on a breakout are simple:
- Enter long if the price moves through the resistance line
- Enter short if the price moves through the support line
This can be done in real-time or at the close of a bar, such as a daily close. Entering in real-time may provide a larger reward because the trade is entered as soon as the price breaks through resistance/support, but there is a higher chance of a false breakout.
Waiting for a bar to close (such as an hourly, daily, or weekly bar) outside of the triangle will cut down on the chance of a false breakout, but if the bar closes significantly outside the formation, the trade may be taking place too late in the move and there will be less profit potential available.
Once a breakout occurs and a position has been taken, a stop can be placed just outside the opposite side of the triangle. If price has moved through the resistance line, a long position is taken and a stop is placed just below the support line.
If price moves through the support line, a short position is taken and a stop placed just above the resistance line. As price moves towards the apex of the triangle, risk will be reduced as the stop price moves closer to the entry price (lines converge).
Figure 1 shows an example of an ascending triangle. A long position is taken on the breakout of the triangle at $12.66 when the former high price within the triangle, $12.65, is eclipsed. A stop loss is placed just outside the opposite side of the triangle at $11.50.
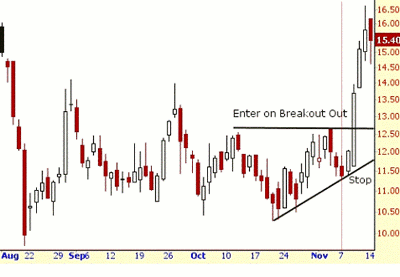
Click to Enlarge
NEXT PAGE: How to Establish Profit Targets
|pagebreak|How to Establish Profit Targets
Ascending, descending, and symmetric all use the same formula for calculating profit targets.
The profit target is attained by:
- Subtracting the high price of the formation from the low price (usually the points where each trendline begins, but not always exactly). This will produce a positive number
- If the breakout is to the upside, add the number from step 1 to the breakout price (the price at which the resistance line was broken). This provides the target for the breakout
- If the breakout is to the downside, subtract the number from step 1 from the breakout price (the price at which the support line was broken). This provides the target for the downside breakout
Figure 2 below shows the same chart from Figure 1, except this time the price points used for profit target calculation and the profit target are highlighted.
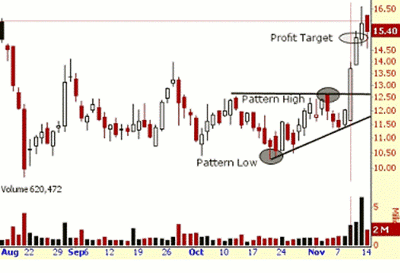
Click to Enlarge
The high price within the pattern is $12.65 and the low price of the pattern, $10.30, is subtracted from this. These prices are both highlighted on the chart. The calculation produces $2.35. Since it is an upside breakout, we use step 2, listed above, and add this to the breakout price of $12.65, providing a profit target of $15. This profit target is hit very quickly.
Volume Confirmation
A reduction in volume can usually be seen from the start of the triangle until the breakout. When a breakout occurs, volume should increase. This does not always occur, but volume can be used as a confirmation indicator. The breakout is less likely to fail if there is a strong surge in volume pushing price in the breakout direction. Figure 2 shows volume increasing on the breakout.
Bottom Line
Ascending and descending triangles possess certain tendencies, but ultimately the breakout direction does not need to be predicted. Triangles can be traded by entering a position when the support or resistance line is broken and a stop-loss can be placed outside the opposite side of the formation.
When a breakout occurs, a profit target can be calculated using the height of the formation and then adding it to the breakout price in the case of upside breakout, or subtracting the height of the triangle from the breakout price in the case of a downside breakout.
Volume can be used as a confirmation signal on breakouts; increasing volume usually means there is less chance of a false breakout.
By Cory Mitchell, Contributor, Investopedia.com


