
A bearish chart pattern now unfolding for physical gold and two related gold indexes suggests potential for a drop to support in the $1500 area, writes Nu Yu, contributor to SafeHaven.com.
The Fed’s recent inference that QE3 was not imminent has caused physical gold and silver, as well as the $HUI and $XAU indexes, to breach their downside support lines.
These transitions set up the distinct possibility that we could well see $1,500 gold and the $HUI and $XAU at 400 and 144, respectively. Let me outline my analysis of the current situation and how it might unfold.
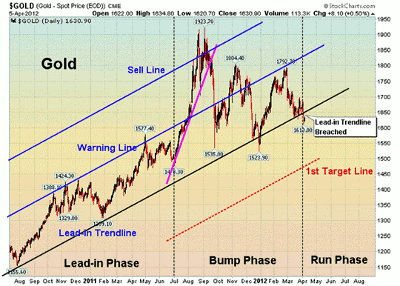
Gold Now on a Downhill Run
Gold had been in a 20-month "bump-and-run reversal top" pattern, but with the recent events, it has transitioned from the "bump" phase to the "run" phase. This should result in a downhill run in price to the first support line at around $1,500.
According to Thomas Bulkowski, the bump-and-run reversal top pattern consists of three main phases:
- A lead-in phase in which a lead-in trend line connecting the lows has a slope angle of about 30 degrees. Prices move in an orderly manner and the range of price oscillation defines the lead-in height between the lead-in trend line and the warning line, which is parallel to the lead-in trend line
- A bump phase where, after prices cross above the warning line, excessive speculation kicks in and the bump phase starts with fast-rising prices following a sharp trend line slope with 45 degrees or more until prices reach a bump height with at least twice the lead-in height. Once the second parallel line gets crossed over, it serves as a sell line
- A run phase during which prices break support from the lead-in trend line in a downhill run
Below is a chart showing how this trend should unfold:
Click to Enlarge
NEXT: 2 Popular Gold Indexes Begin Downside Breaks, Too
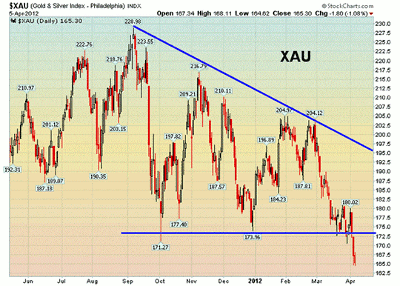
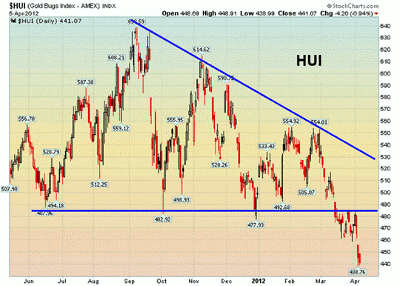
|pagebreak|$XAU and $HUI Indexes Have Broken to the Downside
As the two charts below clearly show, both $XAU and $HUI have broken to the downside from their seven-month "descending triangle" patterns. The descending triangle is a bearish formation confined by an upper descending trend line and a lower horizontal line.
Once a downside breakout occurs, a price target is projected by measuring the widest distance of the pattern, multiplying it by a 54% price target meeting rate, and subtracting it from the breakout.
Therefore, $XAU could fall to 144 and $HUI could fall to 400. Both should decline about 17% as measured from the breakout.
Click to Enlarge
Click to Enlarge
By Nu Yu, blogger, contributor to SafeHaven.com


