Corey Rosenbloom dissects the charts of the S&P, Dow, and Nasdaq, identifying important areas of price support and resistance for the coming sessions and how to trade these events should the levels be triggered.
The week so far has already been active in both directions between short-term exponential moving average (EMA) support and resistance levels. Let’s now take a look at the market action and chart structure to find the most important price levels and suggest trading strategies from here.
Let’s start with the S&P 500 Index:
For reference, in each of the “big three” US indexes, I’ll be focusing on three main levels:
- Current/immediate support
- Next immediate lowest target
- Downside target if these levels break
Before we discuss downside levels, however, it’s important to note bullish upside targets that triggered in the Dow and are one day away from a bullish trigger in the Nasdaq and S&P.
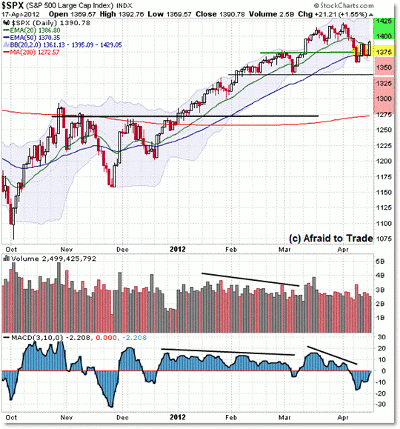
For the S&P 500, there was a quick bull trigger above the falling 20-day EMA at 1,386. This also took out the recent minor high.
I color coded all the charts to highlight the bullish, neutral, and bearish levels in the event price moves into (or continues traveling through) these levels.
The immediate level to watch on the S&P 500 is the round-number 1,400 resistance, though 1,390 is also a reference point to watch as of Wednesday.
The market is bullish short term above 1,390 and triggers a breakout buy above 1,400 which could lead to a retest of 1,420 (2012 high) or even 1,440 (the May 2008 high).
With those upside game planning levels in mind, let’s turn to the bearish levels to reference if the market does fall/reverse under 1,400.
|pagebreak|The first should be obvious. It’s a polarity level from the confluence of the rising 50-day EMA and the February high: 1,370. That’s where the latest rally emerged.
In the event 1,370 fails as a support level, look to the 1,340 zone.
A deeper retracement would trigger if the index broke under 1,340, which would open the market for downside targets of 1,300 (round-number support) and then 1,275 (the 200-day simple moving average (SMA) and prior resistance level).
Though the numbers are different, the structure (and levels) are similar in the Dow:
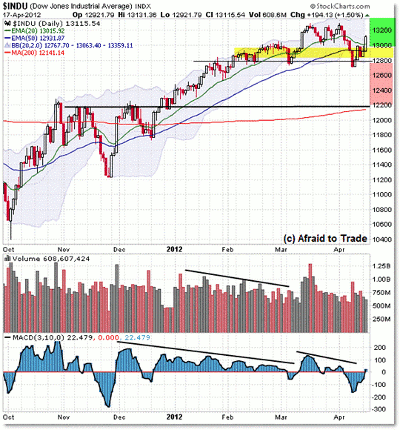
For quick reference, the Dow triggered a price-resistance and 20-day EMA breakout buy signal and could continue creeping its way back to the 2012 high of 13,211.
Unlike the S&P 500, the Dow crested briefly above its May 2008 high of 13,136. We give a little bit more flexibility with levels on the Dow, and 13,200 is an important and easy-to-remember reference point.
The 13,000 level is not only a major psychological round number, but it’s also a recent price polarity level (meaning this level served as both resistance and support) and the location of the rising 20-day EMA.
What levels become important if the Dow breaks under the support at 13,000?
There’s a minor—but important—pivot at 12,700 (similar to 1,340 in the S&P), and if that fails to hold, it opens the door for a deeper retracement towards the 12,200 level and 200-day SMA confluence (similar to 1,275 in the S&P).
And finally, let’s see the structure and similar levels on the tech-friendly Nasdaq Index.
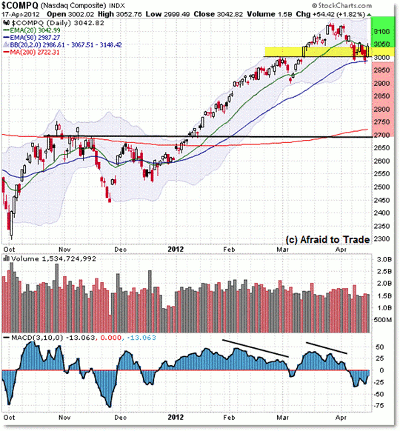
|pagebreak|It’d be nice to call 3,000 the simple reference—and you could—but it may be more precise to label the current Nasdaq pivot level at 2,990 (it’s the 50-day EMA along with the prior swing high into 3,000).
The Nasdaq triggers a bullish buy above the falling 20-day EMA, which currently rests at 3,042. Above this (you could use 3,050 as your easy reference), we could see 3,134 (the 2012 high) revisited again.
With those support (2,990/3,000) and upside target (3,130) levels in mind, let’s turn to potential downside support targets on a retracement from here.
The first one would be 2,900 (that’s easy enough), and then on towards the 2,700/2,750 region (price polarity and the 200-day SMA).
While traditional odds (at least from the charts) favor a further downside move, we have to be on guard and ready to adapt to any bullish surprises the market continues to throw at us. Remember, we’re traders (masters of probability), not fortune tellers!
By Corey Rosenbloom, CMT, trader and blogger, AfraidToTrade.com


