
Significant levels and strong Fibonacci levels converging at the same number creates a very powerful support zone, which provide technically sound entries, says Suz Smith of ExplosiveOptions.net.
The E-mini S&P 500 index futures (that's their daily chart to the below) leads the cash index as globex trades around the clock. If we pay attention to levels and significant events on this chart, we can translate it into an actionable trading plan for the SPY. Generally speaking, I trade SPY using the E-mini, or ES, chart.
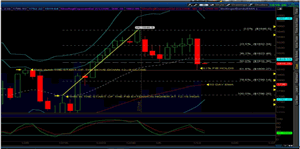
In terms of technical analysis, I look at significant levels and Fibonacci retracements on the chart. A significant level happens when a larger move starts or ends, providing you with the proper anchor point for your Fibonacci drawings.
February gold futures – monthly chart
Click to Enlarge
If you look at the chart, you'll see a comment that notes the significant level 1809.25 as the start of the larger move down to 1753. Notice that the candle sequence touched the first Bollinger band and proceeded down to penetrate the bottom Bollinger band. The candle penetration outside of the bottom Bollinger band is “deviation.”
Because Bollinger bands contain 90% of all price movement, when the candle formation goes into deviation, it is likely to “revert to the mean,” or move back into the Bollinger band complex. As you can see, the candle formed a long wick on the bottom and continued up to create a reversal candle. Mean reversion trades, if traded with proper technicals, can be very profitable.
I typically watch the smaller time frames to gain an entry via SPY calls. The simple act of price moving back into the Bollinger bands gives you a profit cushion and a little confidence to hold the trade for the larger move.
Next, take a look at the comment showing the start of the fib extension on 12/16/13. In order for us to confirm a move higher, we want to see a move above the high of that candle, which we did on the intra-day charts.
Since the move on the reversal candle was so large, the next candle is red, indicating a “digestion” or “consolidation” day. Because you had profit cushion from proper entry on the reversal candle and the candle did not attempt a new low, you had confidence and profit cushion to hold the trade through this day.
The next day went down and retested the bottom Bollinger band, but it did not make a lower low. Instead, it proceeded to make a higher high, thus confirming the uptrend was intact (the trade was in a long setup until it hit the high of 1846.50).
NEXT PAGE: The Nuts & Bolts
|pagebreak|Since the 1846.50 has been confirmed as a top for now (please note I am specifying “a” top, not “the” top) the question becomes, “Where do we go from here, and how to we figure out what to do?”
This is where the Fibonacci drawings come into play. A significant level proves support or resistance. If resistance is overcome, it can become support-and that appears to have happened in the above chart. I anchored the Fibonacci drawing to the start of the move higher and drew a line to the high of 1846.50, leaving the significant level (which occurred at the start of the last move down on 12/9/13) visible since it was our last important technical event.
Take a close look at where the decline halted: 1809. 1809 is BOTH the significant level where resistance became support, AND the 61.8% Fibonacci retracement level.
When significant levels and strong Fibonacci levels converge at the same number, it creates a very powerful support zone. Seek them out, because they provide technically sound entries. If you take an entry on the tag of the convergence zone, you are placing yourself into a high-probability trade with low risk-you can place a stop .20 or so beneath the support zone and let the market take you out with minimal loss.
Let's transfer this concept over to SPY. On the tag of the convergence zone at 1809, I entered February 180 SPY calls at $3.78 and February bull call spreads 180/185 for $2.71. This gave me an entry on the SPY calls very close to the low of the day.
On the bottom of the chart you can see the full stochastic, which I sped up a little bit in order to be more responsive to price movements. The stochastic is not quite oversold yet, but it is making good progress. My favorite trade setup is when the stochastic becomes oversold under the 20 level and then crosses back up (the green line crosses up over red line).
Overall, I would expect to see another test of the 1809 level. If it holds again, we can step up to 1823-25 (Fibonacci level and prior price support), 1832-34 (Fibonacci level and prior price support), and mount a new attack on the prior high of 1846.50.
If we break to the downside, I would expect to see a test of the 50-day ema, which is currently 1796 and rising. Note that the moving averages are rising, and as they do, eventually they can rise to converge at a price higher than where it is now.
Zooming out and using a longer time frame chart can help us identify sustainable longer-term swing trades. Using high-probability setups and low-risk entries enhance our overall portfolio returns.
By Suz Smith of ExplosiveOptions.net


