Is there a connection between crude oil, junk bonds, and the stock market, or is it just a coincidence that all three have fallen concurrently? Chris Vermeulen, of TheGoldAndOilGuy.com, takes to the charts to address this conundrum.
We are approaching the most anticipated and crucial week of the past seven years and the global markets have been selling off. Last week saw crude oil, junk bonds, and the stock market competing with one another, while on their way down. Is there a connection between the three or is it just a coincidence that all three have fallen concurrently? Is the fall of one market signaling a warning sign to the other(s)?
If you have any interest in either market, by way of investments, or if you are planning to become a part of the market, this article is for you. The junk bond markets are flashing a red signal, therefore, you should heed the warning.
What are junk bonds and why are they important?
The bonds issued by companies, which have a low credit rating, are termed as “junk bonds.” Due to their weak balance sheet and their dubious track record, these companies are considered risky. So why would anyone invest in this instrument? With the Fed keeping interest rates near a zero level for the past seven years, the hunger for higher returns have led many to invest in the junk bonds (which offer very high returns compared to the treasury bills).
What is the size of the bond market?
The total bonds issued, since the last financial crisis, have now crossed $9.3 trillion. Yes, you read correctly, it is a trillion with a T. The bonds issued in 2014 reached a record level at $1.3 trillion and the year 2015 has created another new record. According to the Financial Times, 50% of the bonds issued by the corporate world are rated as “junk,” (this figure was at 40% during the 2007 financial crisis).
What is corporate America doing with such massive debts?
Has all this massive debt incurred by companies, been used for infrastructure, R&D, upgrade technology, or for improved businesses? No. Most of the debt has rolled back into the stock market, in the form of buybacks and dividends. According to Bloomberg news, 104% of the profits earned by the companies in the S&P 500 (SPX) were used for buybacks or dividends during the first quarter of 2015. Surprised? Don’t be. They went on to say that the last time the figure crossed 100% was in the second quarter of 2007 and it peaked at 156%, two quarters later. We all know what happened to the stock markets after 2008.
Is it different this time and will the companies return the money?
If you think so, then you are in for surprises. According to S&P, the 12-month default rate on junk bonds was at 2.5% in September 2015, up from 1.4% in July 2014. The S&P has downgraded 297 companies within the first three quarters of this year and upgraded only 172 companies. The rate of the downgrades are the worst since 2009.
According to Bloomberg, the profits of the S&P 500 companies have fallen by $25 billion in the first three quarters of this year. On a share-weighted basis, the profits were down 3.3% on the year in the third quarter (the worst performance since 2009). The fourth quarter earnings are expected to be down by 5%, which will make it three consecutive quarters of negative earnings growth, this year. Aggregate revenues of the group were down by $287 Billion over last year. 17% of all the junk bonds are held by the companies within the energy sector, and with crude oil prices threatening to break the 2009 lows, it is anybody’s guess as to how many of these companies will be able to honor their payments.
NEXT PAGE: The Path of Least Resistance?
The Fed Is Set to Raise Interest Rates in the Coming Week
The Fed is most likely going to raise rates for the first time in almost a decade. The yields on the short end of the market have begun to react and are at their highest level since 2009. With interest rates set to rise, many investors are likely to pile up on the investment grade bonds, rather than remain in the risky ones.
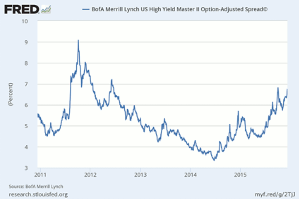
Difference in yields between investment grade and junk bonds.
The below chart shows the difference in yields between the treasury securities and the dollar-denominated junk bonds issued in the US. The spread which reached a low in June of 2014 has been rising consistently and has reached its highest level since 2012, at 6.71%. It is threatening to close the gap of the highs seen during the 2011 European crisis.
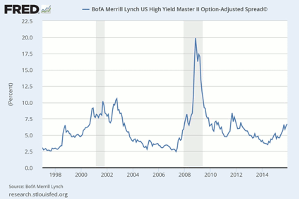
The next chart shows the movement of the yields since 1996. It can be seen that—barring the last time—whenever we crossed 7.5% levels, the US experienced a recession, as denoted by the shaded area in the graph. In 2011, the US Fed was injecting large amounts of QE into the markets, which helped, but with the US Fed expected to hike rates in the coming week, the picture looks bleak.
Frightened? Do you want to redeem your investment in the junk bonds?
The investors of the Third Avenue Focused Credit Fund also wanted their money back, but the Third Avenue Management blocked investors from withdrawing their money and has announced the liquidation of the fund. The investors will now receive a cash distribution on December 16, 2015, and periodic distributions from the liquidating trust over the course of the next year.
The Wall Street Journal reported that a few hedge funds are also following the same path as Third Avenue Focused Credit Fund. Hedge-fund firm, Stone Lion Capital Partners, LP, Caryle Group LPs, and Claren Roan Asset Management, LLC have all taken a similar action and have suspended redemptions.
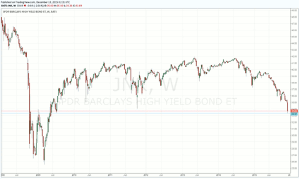
SPDR Barclays High Yield Bond ETF (JNK) is at 2009 levels.
The chart below speaks for itself. The drop on the right side shows the rate at which the ETF has been falling. It’s close to its July 2009 levels. The closing on Friday, marked by the red line on the chart, is very close to the final support marked with the blue horizontal line. Below this support, we will likely see a retest of the lows of 2009.
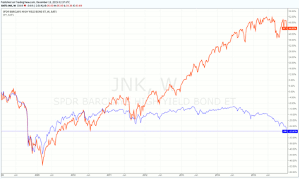
The next chart, shows a comparison between the ETF and SPY. There has been a long-term divergence during the rise of the stock markets, but the similarity of the fall in both the SPY and JNK can be seen on the left hand side. This indicates that the stock markets have a long way to fall and in order to close the gap between the two. The findings of the chart do not bode well for the stock markets in the coming months.
Conclusion
The large drop in JNK to 2009 levels has the markets in a state of fear and panic. With the Fed likely to raise rates this week, the markets look to be on shaky ground. With the makings of the bond market, which is considered to be a precursor to a stock market top, which seems to be in place. The path of least resistance of the stock markets is down. To all investors who are planning to buy this drop, think twice. This is not a Buy the Bounce event.
By Chris Vermeulen of TheGoldAndOilGuy.com


