
Indicators are mixed, and any number of events next week could tip the scales to the bears or bulls, but sideways trading in the short term seems likely to be followed by a solid rebound, writes MoneyShow.com Senior Editor Tom Aspray.
The six-week decline in the US stock market is over, at least for now. Though Friday’s rally gave bulls some hope, on the back of better than expected LEI numbers, it was not enough to change the prevailing bearish outlook for the stock market.
With speculators and many pros still on the short side of the market, and the regular investor either out or very nervous, how much higher can stocks bounce?
Both US and European markets were encouraged by Friday’s press conference from German Chancellor Angela Merkel and French President Nicolas Sarkozy. Their apparent agreement to work with the ECB on a solution for Greece’s debt problem helped calm the markets.
Standard & Poor's downgrade of Greece’s debt early in the week, not to mention the widely televised riots in that nation, had made the markets even more nervous. The plunging euro at mid-week also did not help, as reports circulated that hedge funds were making big bets on a Euro collapse.
On the Asian front, the latest news on the Chinese economy was not encouraging, as its consumer price index for May rose 5.4% from a year ago. Industrial production was positive, suggesting the economy was still growing.
On the property side, residential property prices in China have dropped sharply from the peak of early 2010, as this chart from The Wall Street Journal indicates:

Some technicians are concerned about the Shanghai Composite, as its 50-day moving average closed below the 200-day MA last week. This is referred to by some as the “death cross."
The Hang Seng Index has violated the March lows, but it is more important to me that many of the other major world averages—including the S&P 500, German Dax, and London’s FTSE 100—have not.
This week also has its share of economic data, with existing home sales on Tuesday, followed on Wednesday by the Federal Open Market Committee's announcement and Bernanke’s press conference. We get more data on housing Thursday, with the latest new home sales figures, as well as the weekly jobless claims report.
On Friday comes the durable goods report, as well as the final reading on first-quarter GDP growth. This could set the stage for some fireworks on Friday
The commodity markets turned lower last week, as good weather dampened the extreme bullishness in the corn market and the dollar bounced.
Crude oil also plunged through the key support levels I have been watching. This makes a further decline likely. Over the short term, this will hurt oil-company stocks, but longer term it should be a plus for the economy and consumer sentiment.
NEXT: WHAT TO WATCH
|pagebreak|WHAT TO WATCH
Over the past few weeks, I have been emphasizing that some industry groups have risen since the major averages made their highs on May 2.
As I reviewed in this week’s Trading Lesson, one of the best performing industry groups in 2011 are the health-care providers, which are up more than 19%. It is part of the broader health-care sector that has risen by just over 10%, compared to a 1% gain year-to-date for the S&P 500.
Click to Enlarge
S&P 500
This daily chart of the Spyder Trust (SPY) reveals that the 200-day moving average was tested last week, but the SPY has held above the March lows of $125.28 (line a).
This level is so widely watched that it could be broken. There is further support at $122.90, which corresponds to the November 2010 highs.
The April 2010 highs are just a bit lower at $122.16 (line b), with the longer term uptrend (line c) in the $120 area.
The S&P Advance/Decline (A/D) line is still holding above the March lows. It is trying to stabilize, but needs to start an uptrend to suggest that the lows are in place.
Initial resistance for SPY stands at $128.50 to $130, where a further rally may stall. Much stronger resistance can be found at $131.38 to $132.
Dow Industrials
The weekly chart of the Diamonds Trust (DIA) shows that it has been able to hold above the longer-term uptrend (line e) in the $117.50 area. Last week’s low at $118.55 is still 2.5% above the March lows of $115.51.
The weekly Dow Industrials A/D line overcame its year-long downtrend (line e) in early 2011. This was a positive sign.
The A/D line violated its uptrend (line f) two weeks ago, but has now moved back above it. It is positive that the March lows have held. The A/D line made a significant new high in April, which was a sign of strength.
There is initial resistance for DIA at $121 to $121.68. Then, much stronger resistance in the $122.60 to $123 area should stall any rally.
Nasdaq-100
The PowerShares QQQ Trust (QQQ) dropped below the March lows of $53.77 on Thursday. The plunge in Research in Motion (RIMM) shares on Friday did not help the Nasdaq.
The 38.2% support level from the $41.77 lows is at $52.83, which is the next major level to watch. Last week’s highs of $55.47 represents first resistance, with stronger levels at $56.50.
Russell 2000
The iShares Russell 2000 Trust (IWM) violated the March lows at $77.57 last week, but was able to bounce at the end of the week. The 38.2% support from the 2010 lows sits at $76.11.
First daily resistance stands at $79.68, and a close above this level should signal a rally to the resistance at $80.50.
NEXT: Sector Focus
|pagebreak|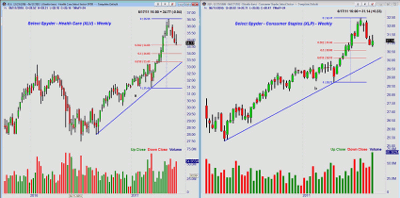
Click to Enlarge
Sector Focus
Two of my favorite sectors have now pulled back to support.
- The Select Sector SPDR - Health Care (XLV) reached the 38.2% support (see chart) at $34.60, with the 50% level now at $34. There is more important support in the $33.40 area and the daily uptrend (line a). If XLV can close above the resistance at $35.63, that would be positive.
- The Select Sector SPDR - Consumer Staples (XLP) dropped below the 38.2% support, with the 50% support to follow at $30.60. The more important support in the $30 area is likely to hold. It did close higher last week on heavy volume, which is a bullish sign. Resistance now stands at $31.50.
- The Select Sector SPDR - Utilities (XLU).also appears to have bottomed, and I recommended several of the utility stocks last week in “3 Best Utility Stock Charts.” These stocks did bounce at the end of the week.
- The other key sectors, including the Select Sector SPDR—Energy (XLE), Select Sector SPDR—Materials (XLB), and Select Sector SPDR - Financial (XLF) all continue to look weak. XLF is oversold and should soon see a rebound.
Click to Enlarge
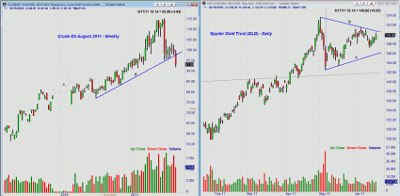
Oil
The break in August crude oil in the middle of the week violated the key support in the $96 area, and signaled a resumption of the downtrend.
The chart shows that weekly uptrend (line a) has been broken, with crude already back to next support in the $92 area. Additional support in the $88-90 area may be tested but crude oil could stabilize later this week.
US Dollar
The PowerShares DB US Dollar Index Bullish Fund (UUP) bounced last week, but there are still no strong signs yet that the dollar has bottomed. There is resistance for UUP now at $21.80 to $21.90, with support at $21 to $21.20.
Gold
The daily chart of the SPDR Gold Trust (GLD) shows a triangle formation (lines b and c). This is likely a continuation pattern that will eventually be resolved to the upside.
We may see a drop back to support at $146 first, and then possibly the $144 area. Volume patterns show no strong bullish signs yet.
Resistance can be found in the $151 to $152 area.
Silver
The iShares Silver Trust (SLV) is looking more negative, as the narrow ranges late last week may be resolved to the downside. A break of support at $33.60 should signal a decline at least to the $32 level, if not lower.
The Week Ahead
The market closed well off the best levels on Friday—yet the selling seems to be drying up for now. Clearly, a catalyst is needed to get those on the short side nervous, and maybe a resolution in Greece will do that.
For now, rallies are likely to fail in the 1,285 to 1,300 area on the S&P 500, as well as 12,300 to 12,500 on the Dow Industrials.
Even if last week’s lows do hold, investors should expect some choppy sideways action before a decent rebound gets underway. Some of the stocks in the strong sectors may have made their lows last week.
I would not get too bearish at these levels, as I discussed in this week’s technical report.


