Chasing stocks higher is likely to be hazardous, and with better entry points likely coming in the near term, patience will be key for investors and traders in the week ahead.
The stock market gained a broad measure of confidence this past week as the S&P 500 surpassed the widely watched 1300 level and held above it, although it was just barely higher on Friday.
The combination of Euro debt downgrades and a heavy calendar of earnings made me think this past week would be more volatile and that stocks would finally correct. Instead, stocks notched steady gains all week.
With inflation-protected bonds now at negative yields, clearly, the appetite for stocks has changed considerably since the Thanksgiving decline. Economic news was better than most expected, as existing home sales hit the highest level in almost a year, manufacturing data showed strong growth, and jobless claims declined sharply.
Jobless claims fell to an almost four-year low and inflation slowed in the last quarter of the year. The number of “double dippers” has declined sharply over the past few months, and of course, bearish sentiment has dropped sharply since with far fewer forecasts of another recession.
Nevertheless, there are some who still think we are already in a recession, and there is bound to be some bad news in the next few weeks to support their case.
Clearly, the stock market is overextended on a short-term basis, and though it could still go higher over the near term, chasing it is likely to be hazardous. Therefore, patience is recommended, and as I will discuss later in the article, I am confident that there will be an opportunity to buy lower.
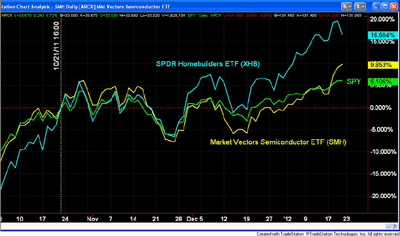
The positive data has finally convinced most that the homebuilding stocks have made a sustainable bottom. These stocks saw a large surge in volume in mid October, which was the first technical sign that a change in trend was occurring. Since October 21, the SPDR S&P Homebuilders ETF (XHB) is up 16.6% versus a 6.1% gain for the Spyder Trust (SPY).
I continue to think that sector selection will be very important in 2012, and the semiconductor stocks saw a similar surge in volume this past week. The Market Vectors Semiconductor ETF (SMH) is up 9.8% since October 21, but as the chart indicates, it has surged versus SPY in the past week.
The chart also reflects that the homebuilders were up almost 20% at the start of last week and gave up some of their gains as the week progressed.
The market was helped by the lack of any new revelations from the Eurozone, though the euro did decline while the market is waiting to see if Greece will come through on its debt restructuring. International Monetary Fund (IMF) and European Central Bank (ECB) officials will resume negotiations next week.
Auctions of Spanish and French debt were well received, which helped push the European stock market averages higher.
The emerging markets are finally showing signs of life, as Brazil cut rates again last week, as expected. The iShares MSCI Brazil Index Fund (EWZ) has recently completed a bottom formation.
The Brazilian economy is now the sixth largest in the world, having passed the United Kingdom, whose unemployment rate hit a 17-year high. Some of the other emerging markets may prove to be excellent opportunities in the coming weeks.
This week, we get more data on the housing market with pending home sales on Tuesday, followed by new home sales on Thursday.
The Federal Open Market Committee (FOMC) also meets on Tuesday with an announcement due on Wednesday afternoon followed by Chairman Ben Bernanke’s press conference. Everyone will be watching closely to see if the Fed’s outlook for the economy has improved with the recent data.
Also due out is the durable goods report on Thursday and the advance reading on GDP for the fourth quarter on Friday along with the latest readings on consumer sentiment.
NEXT: Key Events and Trends to Watch This Week
|pagebreak|WHAT TO WATCH
The lagging action of the Advance/Decline lines had me concerned as we started last week, but that all changed with last Wednesday's action, as the market internals confirmed the price action in the major averages. This is clearly a positive for the intermediate term.
The number of bulls in both the American Association of Individual Investors (AAII) and Investors Intelligence survey declined a bit, with both around 50. A 2% drop in the major averages will likely bring these numbers down a bit more. As I have discussed frequently in the past, crude oil often leads the S&P 500, and crude oil dropped over $1.50 on Friday.
I am still looking for a 2%-4% decline in the major averages, though I recommend concentrating on identifying the levels at which you want to buy either ETFs in the leading sectors, or stocks in those sectors. The seasonal analysis does indicate that a late-January decline generally presents a good buying opportunity. The decline could be shallower than I expect, as many are underinvested in stocks.
Many of the strongest stocks have either completed double bottom or reverse head-and-shoulders (H&S) bottom formations over the past few months. It is normal after the first sharp rally to have a pullback, even to the breakout level, which should present some good risk/reward entries.
One of the most bullish developments for the overall market are the signs that the financial sector may finally be bottoming out. The weakness in this sector for the past year has limited the upside in financial-heavy indices like the S&P 500.
S&P 500
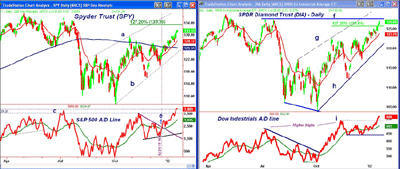
The Spyder Trust (SPY) was finally able to move well above the October 27 high at $129.42 last week, and this now becomes the first level of support. There is further support at $128.15 and the sharply rising 20-day exponential moving average (EMA).
Additional support is at $127-$127.40 while the flat 200-day moving average is now at $125.91.
The S&P 500 A/D line moved above both the October and July highs last week. It is now leading prices higher. The break of the downtrend on December 21 (point e) signaled that a rally was underway.
On the upside, the next target is the 127.2% Fibonacci retracement target at $133.26. The upper trend line resistance (line a) is now at $136.30.
Dow Industrials
The daily chart of the SPDR Diamonds Trust (DIA) shows that it continues to act stronger than SPY, as DIA has already exceeded the 127.2% Fibonacci retracement target at $125.61. It is close to the July highs at $127.30. DIA had a high in April 2011 at $128.63.
The Dow Industrials A/D line also surpassed its October highs (line i) last week and shows a clear pattern of higher highs. It is well above strong support.
DIA is now over 2% above its rising 20-day EMA at $123.67 with good chart support now at $122.50. The lower daily Starc band (Starc-) is now at $121.30.
NEXT: Small-Caps and Tech Stocks in Focus
|pagebreak|Russell 2000
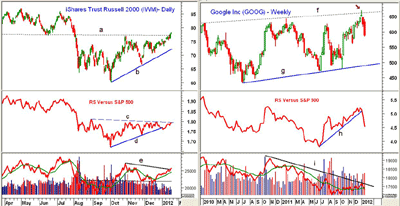
The iShares Russell 2000 Index Fund (IWM) finally moved through the major 61.8% Fibonacci retracement resistance in the $77 area (line a) last week and closed the week above it. The next major resistance is in the $80 area and then at $84.30, which was the July high.
The relative performance, or RS analysis, has not confirmed the price action, as it is still below the resistance (line c). It had briefly violated the uptrend (line d) in December, which was not a sign of strength.
The daily on-balance volume (OBV) has broken its downtrend (line e) but has formed lower highs. This makes me cautious on small-caps for now.
There is now first good support at $74.50-$75.50 and a break below the support at $73.20-$73.30 would be negative.
Nasdaq-100
As I discussed Thursday, the PowerShares QQQ Trust (QQQ) broke its major downtrend and hit its highest level since February 2001. The 127.2% Fibonacci retracement target is at $61.06.
The Nasdaq 100 A/D line has moved above the November highs and is rising strongly. Both the weekly and daily OBV have broken their downtrends and are positive.
As I have been noting for the past two weeks, the RS line was rising, signaling that QQQ was acting stronger than the S&P 500. The RS line is still in a short-term uptrend, suggesting that trend of outperformance versus the S&P 500 continues.
QQQ has now first good support in the $58-$59 area.
Of course, there are some tech stocks that are not acting as well, as the earnings from Google (GOOG) disappointed investors, causing the stock to be hit hard on Friday. The weekly chart shows that GOOG broke through long-term resistance (line f) but closed back below it (see arrow). The following week, the uptrend in the weekly RS (line H) was broken, which was also a sign of weakness.
The weekly OBV had been diverging for the past year, as it had formed lower highs (line i). If support at $560 is broken, GOOG could decline to long-term support in the $490 area (line g).
NEXT: Latest on Sector ETFs, Oil, and Gold
|pagebreak|Sector Focus
The iShares Dow Jones Transportation ETF (IYT) was strong last week but is still stalled below the resistance in the $94.70 area. Longer-term resistance is in the $98 area.
There is initial support now for IYT at $90-$91. I still like the railroad stocks and updated my analysis of them earlier this week. (See “Railroad Stocks Are Still on Track.”)
Last week’s sector ETF winners were the Select Sector SPDR - Technology (XLK), Select Sector SPDR - Materials (XLB), Select Sector SPDR - Financial (XLF), and Select Sector SPDR – Industrials (XLI). The Select Sector SPDR - Utilities (XLU) has declined so far in 2012, which is consistent with the deterioration in the technical studies from early January.
On a decent correction, I will be looking at the industrial stocks, semiconductors, energy, and regional banks.
Oil
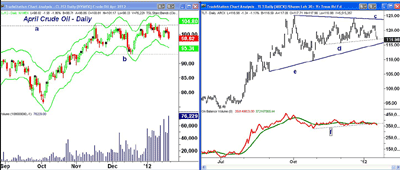
The April crude oil contract was lower all week as the prior week’s failure to surpass the resistance at line a was negative. Crude was 2% lower and may be giving a leading signal on the S&P 500, though it was also lower the prior week.
There is weekly chart support now at $98.25, which, if broken, could signal a decline to the lower weekly Starc band at $95.34. Major support (line b) is still in the $93.15 area.
The heavy volume over the past few weeks has reinforced the negative signal from the OBV mentioned last week. Remember that the seasonal pattern is for crude to bottom in February.
There is resistance now at $110.80-$101.20.
Interest Rates
Rates moved higher last week, as the yield on the ten-year note closed at 2.02%, up from 1.85%. Rates will have to move even higher to suggest that they have bottomed.
The triangle formation in the iShares Barclays 20+ Year Treasury Bond ETF (TLT) appears to be breaking down, as it closed at new lows for the year, which coincided perfectly with the support at line d.
There is more important support at line e in the $115.20 area, which, if broken, would be consistent with higher rates.
The OBV has been in a narrow range for the past few months but is now below its slightly declining weighted moving average (WMA). This is not a positive sign.
Those currently long the iShares Barclays 20+ Year Treasury Bond ETF (TLT) at $118.42, as recommended on December 9, should close out on Monday’s open for a small loss.
Precious Metals
On Friday, I discussed two scenarios for how the SPDR Gold Trust (GLD) might complete its bottom. My favored view was for one more decline. GLD and the iShares Silver Trust (SLV) both had nice gains on Friday.
The volume was not impressive, so I am not yet convinced that GLD has bottomed out, but I will be monitoring it closely. If the lows are in place, we should get a good entry point in the next week or so.
The Week Ahead
I was clearly too cautious last week, but I still don’t think this is the time to aggressively buy stocks. The Dow and the S&P 500 closed higher on Friday, and while the Nasdaq was lower, it was well above its lows. This sets a positive tone for Monday’s trading.
If the Fed turns more bullish on the economy at their meeting this week, it could cause a significant change in the market sentiment, but I doubt it will happen this soon. Some of the stronger sectors have already started to correct, so I will be focusing on buying stocks at lower levels rather than basing my strategy solely on the major averages.
I have been updating past recommendations and have been tightening up some stops. If you have some nice gains from the recent rally, selling part of your positions on strength is never a bad idea. From the extended nature of the major averages, I feel we are more likely to be 2%-3% lower than 2%-3% higher in the next few weeks.
Don’t miss Tom’s latest Trading Lesson: The Dominant Chart Pattern of Early 2012


