
Although the market had a wobbly start, it still ended the week on a strong note, and MoneyShow's Tom Aspray takes a technical look at what's ahead as we enter the seasonally strong period.
It was another wild and quite volatile week in the global markets, but once again those bullish on the US stock market won out. Though there has yet to be any solution in the Ukraine crisis, the initial fear that it will develop into a global crisis has subsided for now.
The sharp drop last Monday frightened some out of their long positions and encouraged the market skeptics. Meanwhile, investing legend Warren Buffett, hardly a market timer, pegged it as a buying opportunity.
This view was confirmed by the new all-time highs the following day as those who went short, Monday, were punished on Tuesday. The new all-time highs in the NYSE Advance/Decline made this sharp spike in selling characteristic of a pullback instead of the start of a more significant correction.
In terms of back-to-back months, we are entering one of the strongest periods of the year. Over the past 63 years, the average gain for March and April is 2.49%. Stocks have been up these months over 66% of the time.
Click to Enlarge
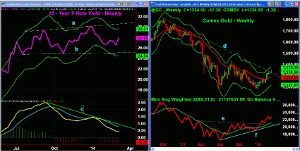
Only November and December have shown a higher historical return. There are quite a few markets, which are being watched closely by global investors. As I mentioned last week, many stock investors have stayed on the sidelines because of the bond market. The weekly chart shows that the yield of 10-year T-notes is still locked in a broad trading range, lines a and b.
Those who are not buying stocks are wondering why yields are not much higher if the economy is really as strong as stock prices suggest. The downtrend in the MACD, line c, is not yet warning of an imminent upside breakout in yields, but I do expect one in the first half of the year. Yields rose from 2.720% to 2.786% on Friday in reaction to the jobs data.
The gold market is also getting much more attention as the weekly chart shows that the downtrend, line d, from the late 2012 highs, line d, has now been tested. Gold was down, Friday, in reaction to the jobs report. The weekly OBV has moved through resistance at line e. This confirms the weekly bullish divergence, line f, and suggests a correction will be well supported.
Overseas the news from the Eurozone was upbeat as the ECB raised its growth rates and left interest rates unchanged as inflation edged slightly higher. They continue to worry about deflation and it will likely take much higher inflation to make the ECB comfortable enough to raise rates. Continued low inflation could spur a cut in rates. The euro has been gaining strength over the past six weeks as it has risen from below 1.35 to over 1.38.
Click to Enlarge
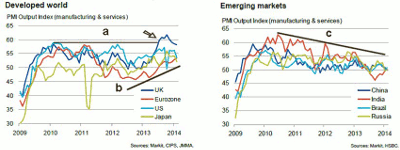
The manufacturing data in the Eurozone continues to improve as now even Spain and Italy are showing improvement with the best rate of expansion in over three years. The PMI Output Indexes for the developed world are all well above 50 and the UK's rate has broken through resistance (line a) and made a multi-year high.
All are still clearly rising, line b, but data reflects some weather-related softening in recent months. The data for emerging markets still looks weak, and even though there has been some improvement from India, its Index is still in a steep downtrend, line c. This data could turn around by the second half of the year.
There is still a high degree of bearish sentiment on the emerging markets, but I think the continued improvement in the developed world will lead to increased consumption of emerging market goods.
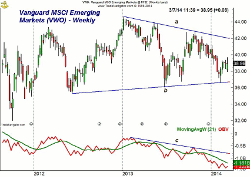
The emerging markets were my contrary opinion play from last August. I recommended a dollar cost averaging strategy. As said then "for Vanguard FTSE Emerging Markets ETF (VWO), I would divide the amount you want to invest, say 5% of your portfolio, and then divide it into six equal parts. The first should be invested on September 3 and then invest another equal portion every three weeks. This will make you fully invested before the end of the year."
Click to Enlarge
The final investment would have been made on November 26. Based on six equal investment of $2000, this position is currently down about 2% as the average price, including reinvesting the dividends is $39.98. This is based on a portfolio of approximately $250,000.
The weekly chart shows that VWO is currently trading at $39 with a long-term flag formation evident on the chart, lines a and b. A weekly close back above the $40 level would be a positive sign and the quarterly pivot is at $41.20. The weekly OBV is trying to bottom out, but is still well below its declining WMA and the major downtrend, line c.
Once we get strong signs of a bottom, I will look to add to this position and I would not want to see a weekly close below the $36 level. Earlier, VWO was also recommended in the Charts in Play portfolio and this position was stopped out for a 4.5% loss.
There were some interesting developments out of China in the past week or so as their currency the renminbi or yuan had its biggest decline in years. Some have concluded that the government-encouraged decline is designed to make China less attractive to speculators. There are some early signs that it may be working.
The other news out of China concerned Shanghai Chaori Solar, a small solar energy company that defaulted on its bonds as it was unable to pay the interest. Those who are bearish on China see this as a warning of much bigger problems ahead, but I think it was more likely part of the government's overall strategy.NEXT PAGE: What to Watch
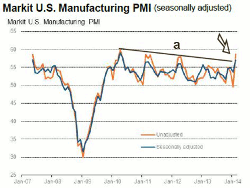
|pagebreak|The much-better-than-expected data on manufacturing last Monday was ignored by the plunging stock market. The chart of the Markit US manufacturing Index shows the sharp upturn last week as it has clearly broken through its resistance (line a), which favors further strength in the months ahead. The weaker-than-expected ISM-Non-Manufacturing Index on Wednesday did make the stock market a bit more nervous.
Click to Enlarge
The better-than-expected jobs report on Friday was followed by weak numbers on factory orders, which fell 0.78%. The calendar is much lighter this week with the jobless claims, Retail Sales, Import and Export Prices, along with Business Inventories out on Thursday. On Friday, we get the Producer Price Index.
What to Watch
The new highs in the S&P 500 were given a huge test on Monday as the conflict in the Ukraine put stocks under heavy pressure from the opening. The selling was quite heavy as noted by the high readings in the Arms Index. As I noted in last week’s trading lesson, this was more characteristic of a pullback than the start of a deeper decline.
Friday’s action was pretty choppy as most of the major averages could not hold the initial strong gains in reaction to the surprisingly good jobs report. Still the major averages closed with nice gains for the week but mixed on Friday.
Despite the lofty levels of the key market averages, and with many wondering how much higher the market can go, there are no signs yet of a significant top. Further sharp selloffs, and even a several-day correction, are clearly a possibility and could be triggered by economic news or more saber rattling by Russia.
The market continues to rotate between sectors as the previously strong utilities have given up some of their gains while the recently recommended regional banking sector is doing quite well. The SPDR S&P Regional Banking ETF (KRE) is up 10% in just the past 12 trading days.
The transportation stocks are also doing quite well as the Dow Transportation Average moved above the January highs on Friday, making a new all-time high. Last week, I took a look at some transportation stocks that looked quite strong.
The monthly review of the Dow Industrial stocks also revealed some large-cap, high-yielding stocks that were back to important support. Though the Industrials are still the weakest market sector, with yields like T-notes and growth potential, these stocks may soon look more attractive.
The sentiment was little changed from last week according to AAII, 40.51% are bullish and the bearish percentage has risen to 26.6% from 21.1% the past week.
Looking at how many stocks are above their 50-day MAs, shows that they are just above the mean in the S&P 500 as the five-day average is at 71.1%. It has not yet moved above the previous peak but is still below the highs seen in late 2013.
Click to Enlarge
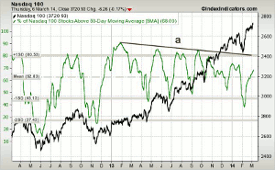
This week, I thought I would look at the super-hot Nasdaq 100 as the PowerShares QQQ Trust (QQQ) has been a leader this year. As I noted last week in my review of healthcare stocks, biotech has lead this index higher but did look a bit more toppy late in the week.
The five-day MA of Nasdaq 100 stocks was at 68% as of last Thursday’s close, which is still below the November peak of 75%. The downtrend is now in the 80% area, line a. If this % starts to roll over, it may be warning of further correction is likely.
NEXT PAGE: Stocks
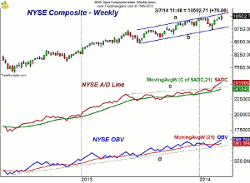
|pagebreak|The weekly chart of the NYSE Composite shows the new highs last week after a brief break of the prior week’s lows on Monday. The weekly starc band will be at 10,660 this week, which corresponds to the upper boundary of the trading channel, line a. The quarterly projected pivot resistance is at 11,048.
The rising 20-day EMA was tested last Monday and has risen now to 10,341. Monday’s low was 10,276, just above the level of 10,268 I pointed out last week. The monthly pivot for March is at 10,221 with further support in the 10,000 area.
Click to Enlarge
The weekly NYSE Advance/Decline is well above its resistance at line c, as it broke out at the end of the year. It is well above its rising WMA. The daily A/D line (not shown) also made new highs last week.
The new highs have been confirmed by a new high in the NYSE OBV as its WMA is just starting to move higher.
Click to Enlarge
S&P 500
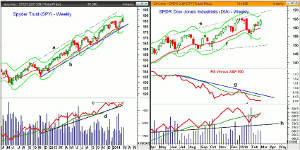
The weekly chart of the Spyder Trust (SPY) still looks strong with last week’s action. The weekly starc+ band is now at $190.75 and the SPY has made new closing highs for the past two weeks. It would take a weekly close under $182.60 to weaken the chart.
The 127.2% Fibonacci retracement target at $188.01 was exceeded on Friday as the high was $188.96.
There is minor support at $186.75 with the 20-day EMA now at $184.76. The monthly pivot is at $182.38 with the 20-week EMA and longer-term uptrend, line b, in the $179-$180 area.
The weekly on-balance volume (OBV) has confirmed the new highs by moving through the resistance at line c. The daily OBV also made a new high last week as it had been lagging the price action.
The daily S&P 500 A/D line (not shown) is still confirming the price action as it broke out to the upside in the middle of February.
Dow Industrials
The weekly chart of the SPDR Dow Industrials (DIA) shows that it is still below the early-2014 high of $164.93. The weekly starc+ band is at $167.29 with the monthly projected pivot resistance at $166.96. The weekly trend line resistance, line e, is now at $168.40.
The weekly relative performance has been below its WMA for all of 2014 and is well below its WMA and the major downtrend, line g. This is consistent with the Dow Industrials being a market-lagging, not leading, sector. There has been some slight improvement in the daily RS analysis.
The weekly OBV has just recently moved above its WMA and has major support now at line h. The heavy selling early in February caused a sharp drop in the OBV. The daily OBV (not shown) is still well below its late 2013 highs.
The Dow Industrials A/D line made another new high last week and its WMA is clearly rising.
Click to Enlarge
Nasdaq-100
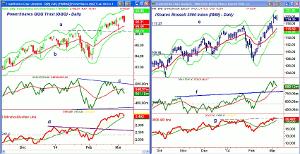
The PowerShares QQQ Trust (QQQ) failed to make new highs on Friday and looks ready to close below the lows of the prior three days. A weekly close below $88.94 was needed to trigger a low close doji sell signal.
Last Monday’s low at $88.87 is the next key level of support with the monthly pivot for March at $88.25. The daily starc- band is at $88.71 with the monthly S1 support at $86.92. The quarterly pivot and major support is at $83.66.
The daily OBV has turned lower from its flat WMA and is clearly diverging from prices as indicated by line c. The weekly OBV has confirmed the recent highs and is well above its strongly rising WMA. This suggests that a pullback should be well supported.
The daily relative performance not shown has dropped below its WMA and appears to have now completed a short-term top.
The Nasdaq 100 A/D line did make a new high last week but turned lower on Thursday. The impressive breakout through resistance in February (line d) is positive for the intermediate term.
Russell 2000
The iShares Russell 2000 Index (IWM) was also unable to hold its gains late in the week as it reached its daily starc+ band last Tuesday with the high of $120.58. It still had a good week as it closed with nice gains.
There is first support now at $117.37, line e, which corresponds to January’s high. The rising 20-day EMA is at $116.59 with the daily starc- band a bit lower. There is monthly pivot support at $114.50, which is well below Monday’s low of $115.58.
The daily OBV staged an impressive breakout last month as it moved well above the prior highs, line f. The weekly OBV (not shown) has also made new highs, and therefore, the multiple time frame OBV analysis is positive.
The Russell 2000 A/D line is acting weaker than the NYSE, S&P 500, or Nasdaq 100 A/D lines as it has just made slight new highs. It is lagging the price action.
NEXT PAGE: Sector Focus, Commodities, and Tom's Outlook
|pagebreak|Sector Focus
The iShares Dow Jones Transportation (IYT) made a new all-time high last week at $136.94, which was well above the prior high of $135.93 set early in the year. The weekly starc+ band is at $139.50.
The monthly projected pivot resistance at $134.64 has been exceeded with the quarterly at $143.99. There is initial support now in the $132.50-$134 level, basis the chart, with the rising 20 day EMA at $132.
The daily and weekly relative performance (not shown) are both now back above their WMAs indicating that the transports are again a market-leading sector.
Click to Enlarge
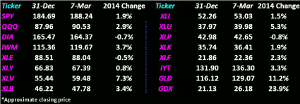
Of the market-tracking ETFs, only the SPDR Dow Industrials (DIA) is still in negative territory for the year. The surge last week in the small-cap stocks has pushed the iShares Russell 2000 Index (IWM) ahead of the PowerShares QQQ Trust (QQQ) as it is now up well over 3%.
A review of the daily charts shows that the Select SPDR Consumer Discretionary (XLY), Select SPDR Materials (XLB), Select SPDR Financials (XLF), and the Select SPDR Industrials (XLI) acted the best last week. They all made convincing new highs.
The Select SPDR Utilities (XLU) has dropped 2.2% in the past two weeks as there has been some rotation out of the utility sector. The Select SPDR Health Care (XLV) made new highs during the week but closed lower on Thursday and Friday. It is still up well over 7% in 2014.
The Select SPDR Energy (XLE) held its gains late in the week and is trying to break out of its sideways trading range. It is still down slightly for the year despite the strength in crude oil.
Click to Enlarge
Crude Oil
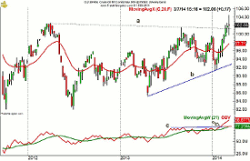
The weekly chart of the May crude oil contract shows the break above resistance, line a, that occurred three weeks ago. This goes back to the 2012 high, which was at $102.52.
The range was quite wide last week as it hit a high of $104.48, last Tuesday, but closed just below $102. The OBV broke through its resistance, line c, two weeks ahead of prices and looks quite positive. If prices correct further, the OBV could drop back to its rising WMA.
Precious Metals
As I noted earlier, the weekly technical outlook for both the SPDR Gold Trust (GLD) and the Market Vectors Gold Miners (GDX) has improved, but I do not think you should chase these markets as the risk is high. I will be watching closely for a better entry level.
The Week Ahead
The major averages posted nice gains last week and more of the sector ETFs that I track have moved into positive territory for the year. The action in the market-leading Nasdaq 100 was sloppy as it shows a loss of short-term momentum. This may be setting the stage for a pullback, especially in the overextended biotech stocks.
There are no signs yet of a meaningful correction at this time as they normally take longer to form. There are plenty of nervous investors out there, as well as those that hope they will finally be right on the short side, so be prepared for periodic waves of selling.
There are sill quite a few stocks that are testing strong support and have not participated in the gains, so far, this year. If investors start to get more defensive, we may see the large-cap, high-yield blue chips start to catch up.
On a longer-term basis, the continued improvement in the economic data in both the US and Eurozone should lead to even higher stock prices as the year progresses. This should benefit both the materials and industrial sectors, as well as the emerging markets.
This is not a time to be complacent, and I hope you will spend some time this weekend reviewing your portfolio. Be sure to have your stops in place, and if you have stocks that have surged 10% recently, take some profits. Have a plan in place so you will not react emotionally to unexpected declines like last Monday’s.
No change for those who are following the dollar cost averaging in an S&P 500-tracking ETF or mutual fund that I recommended in the January 24 column, A Path to Investing Success in 2014.
Don't forget to read Tom's latest Trading Lesson, Profiting from Panic Selling.


