
This sector has been the star performer in the current bull market, and MoneyShow’s Tom Aspray investigates whether there are still good buys to be found here.
Overseas markets are being hit hard in reaction to the increased tensions in Ukraine, with the German Dax down well over 2%. The Russian ruble, which has been under pressure dropped even further, forcing a rate hike by the Bank of Russia. Crude oil and gold were also higher as the markets never like uncertainty.
The US futures are also sharply lower after last week’s impressive close pushed the Spyder Trust (SPY) to almost a 1% gain for the year. The S&P futures are down over 20 points a few hours before the opening and the SPY has support to watch in the $183 area.
The Select Sector SPDR Health Care (XLV) held above its quarterly pivot during the market’s early 2014 correction and continues to be a market leader. In fact, XLV is up over 7% so far in 2014.
Though XLV closed February above its monthly starc + band, there are some stocks in this hot sector that appear to have just completed their corrections. These three healthcare stocks generated positive volume signals last week and this indicates that they are being accumulated.
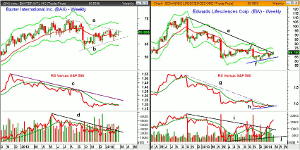
Click to Enlarge
Chart Analysis: The weekly chart of Baxter International Inc. (BAX) shows that the downtrend, line a, is now being tested.
- There is further resistance in the $70.74 area, which was the January high.
- The quarterly projected pivot resistance is at $72.13 with the weekly starc+ band at $72.84.
- The relative performance has been in a narrow range for the past few weeks and closed last week just a bit below its WMA.
- The RS line has key resistance now at the downtrend, line c.
- The weekly on-balance volume (OBV) has decisively broken its downtrend, line d, and has moved above is bottoming WMA.
- There is first good support in the $68.50-$69 area with the quarterly pivot at $67.23.
- The weekly uptrend, line b, is now just below the $67 level.
Edwards Lifesciences Corp. (EW) has a market cap of $7.6 billion; the company focuses on providing technology, as well as products to combat cardiovascular disease.
- The long-term downtrend from the 2012 high at $110.79, line e, was broken last week.
- Friday’s close was above the quarterly pivot at $68.52 with next major resistance at $73.48.
- The weekly chart shows the formation of higher lows, line f.
- Once below the pivot, there is further support at $67-$67.80.
- The relative performance is trying to bottom out as it has formed higher lows, line h.
- The downtrend in the RS line has been broken but further strength is needed to signal that EW is a market leader.
- The OBV action has been very strong as it formed a bullish divergence as it bottomed last May, line j, while prices made lower lows.
- The divergence was confirmed by the move through the downtrend, line i, and above the previous highs.
NEXT PAGE: 1 More Healthcare Stock Tom Likes
|pagebreak|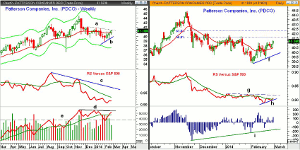
Click to Enlarge
Patterson Companies, Inc. (PDCO) is a $4.16 billion wholesaler of medical equipment, which has a yield of 1.6%.
- The weekly chart shows a short-term uptrend, line b, over the past four weeks.
- The downtrend, line a, is now being tested with the next resistance in the $41.60-$42 area.
- The monthly projected pivot resistance is at $42.03 with the November high at $44.22.
- The weekly relative performance did not confirm the late 2013 highs, line c.
- The RS line is still below its declining WMA.
- The weekly OBV has turned up sharply from the important support at line e.
- The OBV is back above its WMA and is close to key resistance at line d.
On the daily chart of Patterson Companies, Inc. (PDCO) one can see that the 20-day EMA was tested last week. It is now at $40.47.
- The 50% Fibonacci retracement resistance is at $41.48 with the 61.6% level at $42.12.
- The higher lows in the relative performance, line h, are positive.
- The RS line needs a move above resistance at line g to confirm a bottom.
- The Aspray’s OBV Trigger (AOT) bottomed last November and has formed a series of higher lows, line i.
- It is now well in positive territory suggesting that a bottom is in place.
- The daily uptrend is at $39.66 with the monthly projected pivot support at $39.54.
What It Means: The sharply lower opening that is expected on Monday will not cancel the current bullish readings from the technical studies as reviewed in Friday’s Week Ahead column.
It could result in a multi-day pullback but I do not think a significant top is in place. It should be an opportunity to buy stocks in the best sectors at lower levels, and I like these three healthcare stocks.
How to Profit: For Baxter International Inc. (BAX), go 50% long at $69.02 and 50% long at $68.14, with a stop at $65.83 (risk of approx. 3.8%).
For Edwards Lifesciences Corp. (EW), go 50% long at $68.14 and 50% long at $67.64, with a stop at $64.47 (risk of approx. 5%).
For Patterson Companies, Inc. (PDCO), go 50% long at $40.71 and 50% long at $40.08, with a stop at $39.13 (risk of approx. 3.1%).


