
Jared Woodard of CondorOptions.com answers the question of whether it is profitable to arbitrage volatility risk premium when transaction costs are factored into the equation.
Some market inefficiencies are not easily exploitable. Sometimes, large inefficiencies become popular enough that the activity of arbitrageurs makes them into small inefficiencies. And sometimes small inefficiencies are small enough that it is not profitable for participants to arbitrage them away.
Clients ask sometimes whether strategies designed to exploit the volatility risk premium (VRP) would still be profitable after accounting for transaction costs. This is one way of asking whether the presumed market inefficiency is large enough to be exploitable. To answer that question, we need to know two things:
- What is a representative VRP trade?
- What are representative transaction costs for such a trade?
A representative trade might be to sell an at-the-money put option and hedge the delta of the put daily at the market close. For example, assume you have a volatility forecast for the S&P 500 index four months out of 12.50%. If your forecast is correct, and you can sell an option at some higher implied volatility and hedge effectively, the position will be profitable.
Transaction costs in this case include commissions on the option, commissions on the hedging trades, and slippage from the bid/ask spread on the option. Calculating expected commissions for the option is straightforward, but the cost of commissions on the hedging trades will be harder to estimate, since they are a function of how accurate the forecast is: if the underlying is more volatile than expected, larger hedging trades will be placed and commissions will be higher.
Slippage is a little more interesting. First, there’s a general point to be made here about the popularity of volatility indexes. Indexes of implied volatility provided by options exchanges and data vendors are very helpful for broad-level analysis and comparison, but an index is no substitute for a volatility estimate derived from live quotes on a tradable option in a market. Even if a volatility index is part of the inspiration for a strategy, it’s always up to real quotes to validate that strategy.
So in the case of this put-selling trade, we have to see what’s offered in the market to know whether the forecast is valuable. Here are recent closing prices for some four-month at-the-money put options on underlyings that track the S&P 500:
| Asset | Bid, IV % | Ask, IV % |
| SPX | 14.90 | 15.56 |
| ESZ3 | 13.99 | 14.45 |
| SPY | 15.71 | 15.87 |
| IVV | 14.57 | 15.62 |
Those are SPX options, December 2013 E-mini S&P futures options, SPY ETF options, and IVV ETF options. I’m not an expert on low-cost ETFs, but I see IVV in people’s portfolios pretty often.
Anyway, it looks like we can answer the main question of this post affirmatively even if we just hit the bid and go home. If your stipulated correct forecast is for 12.5% volatility, and you can get paid 14-15% to commit to that forecast, you should expect a positive return. A negative return would probably be due to some hedging error.
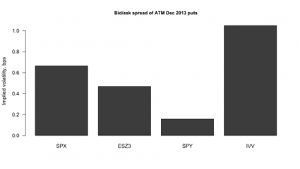
Figure 1 – WYNN price chart as of August 8, 2013
Click to Enlarge
While we’re talking about negotiating bid/ask spreads, notice that although these assets are really close cousins, liquidity makes a big difference. Trading in penny-wide SPY options means giving up less than 0.20 volatility points in slippage, while doing the same trade in illiquid IVV options will cost more than 100 bps. Another complicating factor is the fact that SPX option quotes, while generally wide on the screen, are often more favorable when it’s time to execute; that is, you can usually find a good spot in the middle of the spread.
By Jared Woodard of CondorOptions.com


