As the effects of the impasse in Washington rippled through the entire US, Jared Woodard of CondorOptions.com shows one more area that has felt its results.
We noted to clients earlier this week that VIX option premiums were finally catching a bid, consistent with market participants repricing risk as the debt ceiling looms closer. Thursday’s broad market selloff was a continuation of that trend, accompanied as it was by large increases in equity and equity index implied volatility.
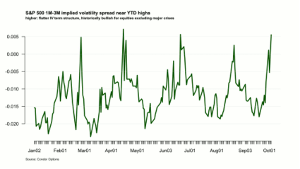
We also saw significant movement in the term structure of implied volatility. A chart of the difference between one and three month at the money S&P implied volatility is below.
Historically, very high IV term structure has been associated with short-term market bottoms and has been bullish for equity prices/bearish for volatility, excluding crash scenarios like 2008 and autumn 2011. Whether to interpret this market extreme as a risk warning or as a major opportunity depends, therefore, on your expectations for the resolution of the political situation.
Another wrinkle worth noting is that, with historical volatility at such low levels (one-month SPX HV < 10%), elevated term structure is even more unusual. Since 2007, there were only a handful of occasions when near term IV was this high relative to medium-term options and historical volatility was so low.
By Jared Woodard of CondorOptions.com


