
No doubt you're aware that gold is trading at 6-year highs, having just surpassed the $1500/oz mark a few days ago. The gold bugs are out in force, telling us that this time it's going to shoot past $2000, and maybe even up to $5000 or more.
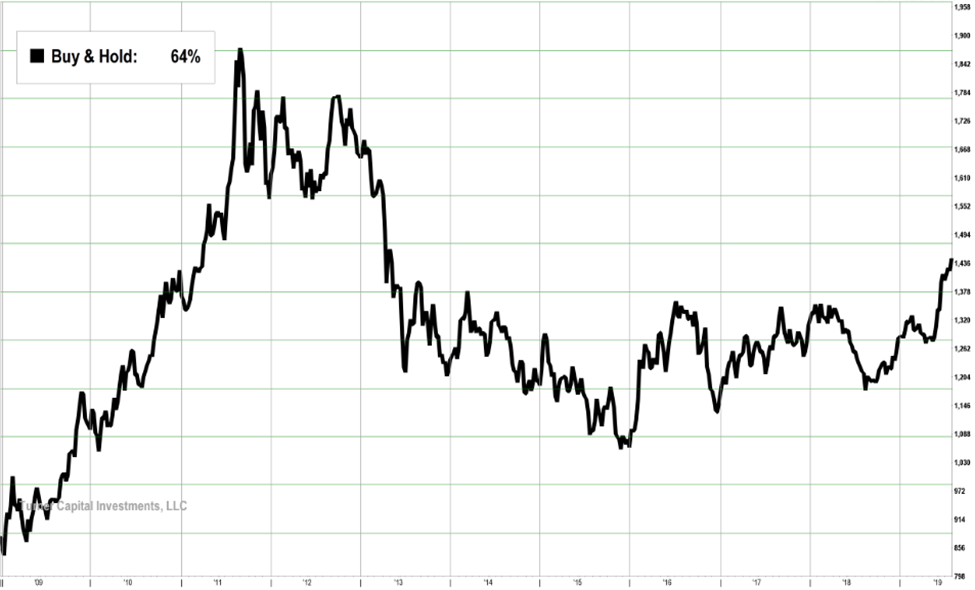
Here's a look at the last ten years of gold prices. If you had bought gold at the end of the financial crisis (and really, who did that?), you're sitting on a nice gain, all of which occurred in the two years after the financial crisis ended.
Of course, since that time, it's been a tough ride for gold and the gold investors who have suffered through most of the past seven years losing money. Only recently has gold begun to take off again. Here's a chart to remind you what's happened in the past 8 years.
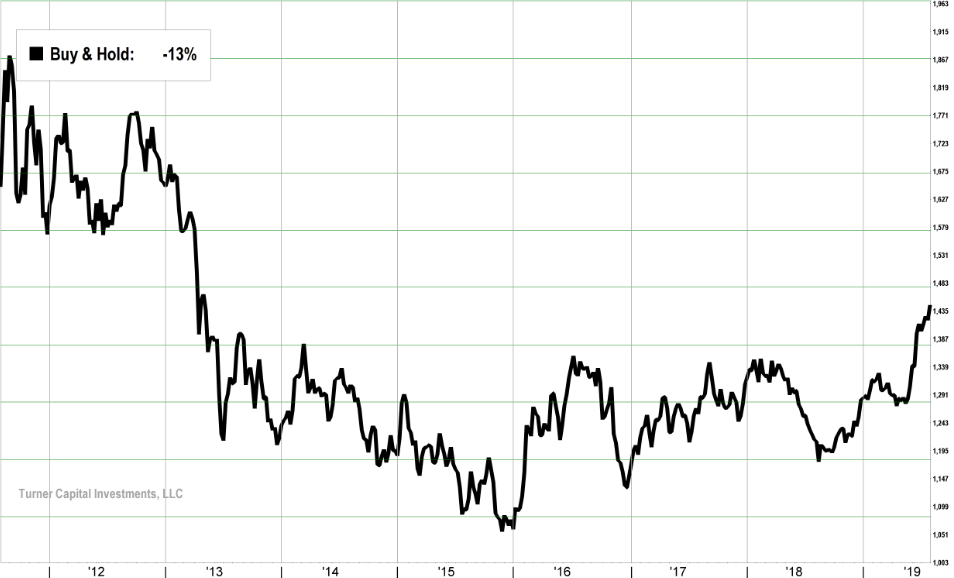
Even with the recent move higher, it's not a pretty picture. Not only have you lost money, but you've missed out on stock market investments that have skyrocketed over the same period of time.
Gold is a different asset class. It doesn't pay dividends, has no earnings, no CEO or board of directors (many would say that's a good thing), and won't necessarily move higher if the economy does well. And that doesn't include all of the additional expenses associated with owning gold including storage, assay costs, etc. Of course, you could avoid those expenses by owning the GLD ETF, but you'd still have lost money over a long period of time, which nobody wants to do, especially when the stock market was making new all-time highs for years.
I understand the idea of gold as a generational asset, an asset that doesn't deteriorate, and that has recognizable value around the world. I know it has been used in dangerous times to save families from destruction. However, as a money manager with fiduciary responsibilities, I can't blindly invest my clients' monies in this type of investment.
But what if there was a more intelligent way to trade gold? Instead of just buying and holding, which hasn't worked for most of the past decade, what if there was a way to know when's the best time to be long gold and the best time to be short gold?
There is a way, and I'll show you how. For those who don't know me, my name is Mike Turner. I'm the CEO and founder of Turner Capital Investments, LLC in Austin, TX (there's more information here). My background is in engineering, computer science, and finance. I sold my large enterprise-level software company (it was in the pharmaceutical industry) in the mid-1990s. I began developing computer algorithms to help me invest my money for growth and capital protection.
It took me more than 10 years to develop the concept I call Market-Directional Investing. There's a fundamental truth in the markets. Stocks and commodities don't trade in a straight line. They trade in trends, with trends moving higher and trends moving lower. Some trends last a short time, but some trends can last for months at a time. Finding these trends can allow the investor to make large gains in a relatively short period of time. This is not a get-rich-quick scheme, it's simply a way to get on the right side of the market at any time.
My Market-Directional Investing methodology uses computer algorithms to measure where stocks, ETFs, indices, and commodities are in relation to their current trend. I measure where the markets are at any time and don't guess on where they might go in the future. Here's the same 10-year chart, but this time there's a yellow channel overlaid. This is called the Transition Zone.
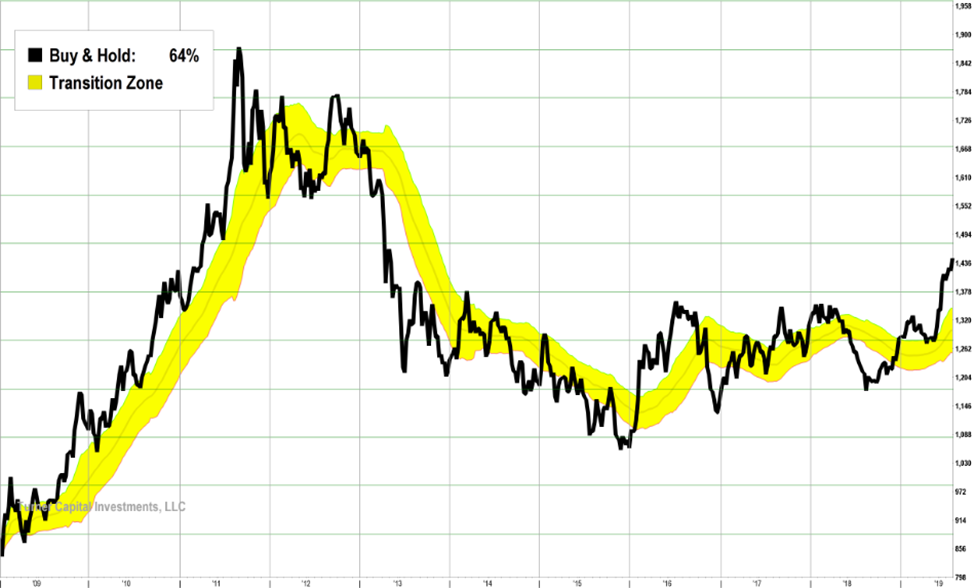
When the stock or commodity you're following is trading above the yellow band, that's a bullish signal and you want to go long. When it's trading below the yellow band, that's a bearish signal and you want to go short. When it's trading inside the yellow band, that's a neutral signal and you want to move to cash and wait for the next trend to occur.
Simple, right? And the beauty of this is you're not having to listen to the media, not having to guess which way next, not having to question the trade. And each trade has its exit strategy updated on a weekly basis. Simple, and extremely powerful.
How would you have done if you had this system available for you to trade gold in the past decade? How about outperform buy and hold by more than 3-1!
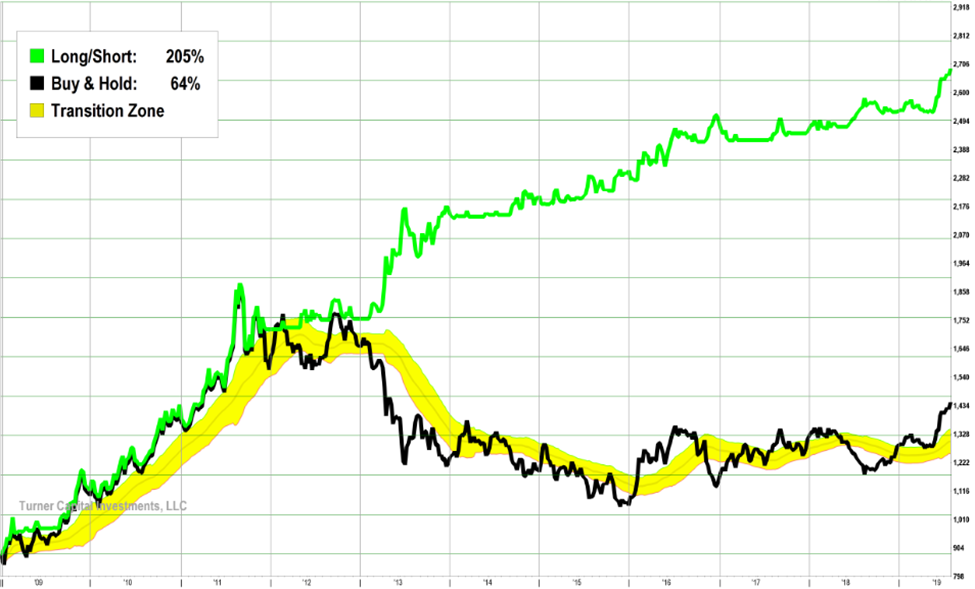
If you had gone long when the system told you to be bullish and gone short when the system told you to be bearish, you could have earned more than 200% in ten years.
And that's just on the underlying price of gold itself. If you have been trading the commodity futures contracts for gold, you could have had gains of 1000% or more!
Now that's investing intelligently!
I'll be showing you the results on other highly-liquid commodities over the next several weeks including silver, crude oil, and natural gas.
Measure, don't guess,
Visit www.turnercapital.com or contact us at info@turnercapital.com.
TURNER CAPITAL INVESTMENTS, LLC
GROWING AND PROTECTING CLIENT CAPITAL IN BOTH BULL AND BEAR MARKETS
IMPORTANT:
Please note the chart referenced above is hypothetical in nature and does NOT represent actual trading. Past performance is not indicative of future returns and all performance numbers noted herein are purely theoretical and do not represent actual trades, the cost of trades, tax consequences or management fees. No recommendation is being made to buy or sell any security. Investing in the stock market involves a great deal of risk, including the loss of all or a portion of your investment, as well as emotional distress. Nothing contained herein should be construed as a warranty of investment results. All securities trading, whether in stocks, options, or other investment vehicles, is speculative in nature and involves substantial risk of loss. Turner Capital encourages you to read the investor information available at the websites of the Securities and Exchange Commission at www.sec.gov, the Financial Industry Regulatory Authority at www.finra.org, and the Options Clearing Corporation at www.optionsclearing.com. A critically important aspect of this strategy is how it performs against the S&P 500 index in a bear market. If no bear market is encountered, the performance is much lower than shown in the chart, above.


