
The S&P 500 Index (SPY) just made a new record high. But with valuations stretched, the question remains as to whether this is a market top or whether stocks can forge even higher. Market breadth supports the bulls.
Let us ask the question of how much market risk we might be facing if, in fact, this week’s readings turn out to be the last time in the current rally when both the S&P 500 and the New York Stock Exchange Composite (NYSE) A-D line set coincident all-time highs.
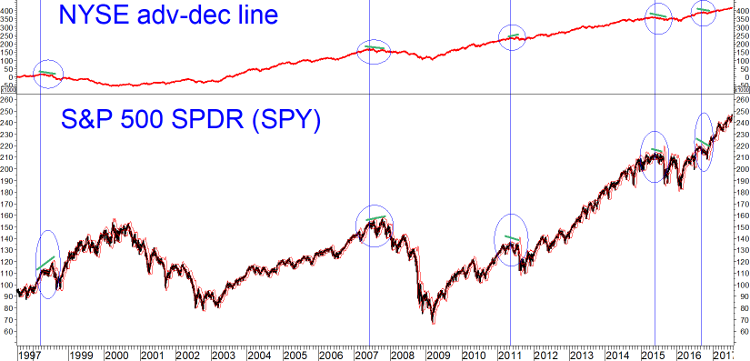
The chart above shows occasions over the past 20 years (circled) when this has occurred. Of course, these ultimate highs were identifiable only with hindsight.
Along the way to the ultimate highs, both price and A-D line made many earlier records along the way up just as the S&P 500 Index has closed at record highs more than two dozen times this year so far.
Following each of these five peaks, either the A-D line (four out of five) or the S&P 500 (2011 only) pulled back slowly.
It was two months or longer after the coincident peak before any significant market decline occurred. This historical precedent suggests that we are safe for at least two more months even if we are at or near a major market top.
Of course, with our equity models being overall neutral-bullish it is more likely that stocks have even further to advance in the months ahead.
Technical note: Some are skeptical of advance-decline data
The NYSE Advance-Decline line is a running total of the number of individual issues that advanced each day minus the number of issues that declined.
The number of issues advancing or declining includes not only operating companies but also closed-end funds, preferred stocks and ETFs.
Does the inclusion of so many non-operating companies (with an overweight to interest-sensitive issues) impair the validity of market breadth data?
Some have said yes but in our own experience (and that of Tom McClellan, for example), using the raw advance-decline data on NYSE-listed stocks has been most fruitful. In contrast, the Nasdaq advance-decline line has been a less reliable gauge and has had a long term downward bias.
The last peak in the Nasdaq A-D line was in 2014, even though the Nasdaq Composite Index (IXIC) has advanced strongly since then and, like the S&P 500, is at record highs.
Subscribe to investment newsletter Systems and Forecasts here…


