
As we continue to wait for signs of life in the crypto market, I thought I would follow up my article, Opportunity: Ethereum, with a look at another coin, EOS. I’ll continue to look at coins until I see action in the crypto market worth writing about, writes Ryan Wilday of Elliott Wave Trader.
What is EOS?
EOS has been lauded as the ethereum killer. While currently it is a coin running on the ethereum platform as a smart contract, the full release is expected in July, last I heard, when current EOS holders will be able to exchange for the real product.
At the time of release, many smart contracts and decentralized apps (DAPPS) are expected to run on it. Many expect EOS to lead ethereum because supposedly it can run transactions far more efficiently.
EOS is the brainchild of Dan Larimer, believed by many to be a unique genius in the world of blockchain, and who has help bring about the bitshares decentralized exchange, and the Steemit social media network.
EOS is still in development and claims of success have yet to be proven.
Can we trust EOS as a long-term investment?
Honestly, after learning to apply the Elliott Wave Theory, I stopped using fundamental viewpoints to shape decisions and look only at price action.
Where fundamental research generally doesn’t give meaningful price targets, points at which to enter and exit, Elliott Wave does.
Where fundamental research often reveals limited information, lacks inside information, or is based on questionable valuation models, price action is fact. Price action is the sum of the sentiment of all participants in a market: rank and file, professional, and those with insider information. Elliott Wave is what I use to discern sentiment.
So, what does Elliott Wave say about EOS?
I have two views I’ll share with you, based on the current structure of action off the October 2017 low. In both views it seems we are likely coming into a low of sorts, and future targets depend on how we view the structure off that low.
Both are valid, applying Fibonacci levels and Elliott Wave that we use on ElliottWaveTrader. This method is called Fibonacci Pinball and was created by Avi Gilburt.
Wave Two
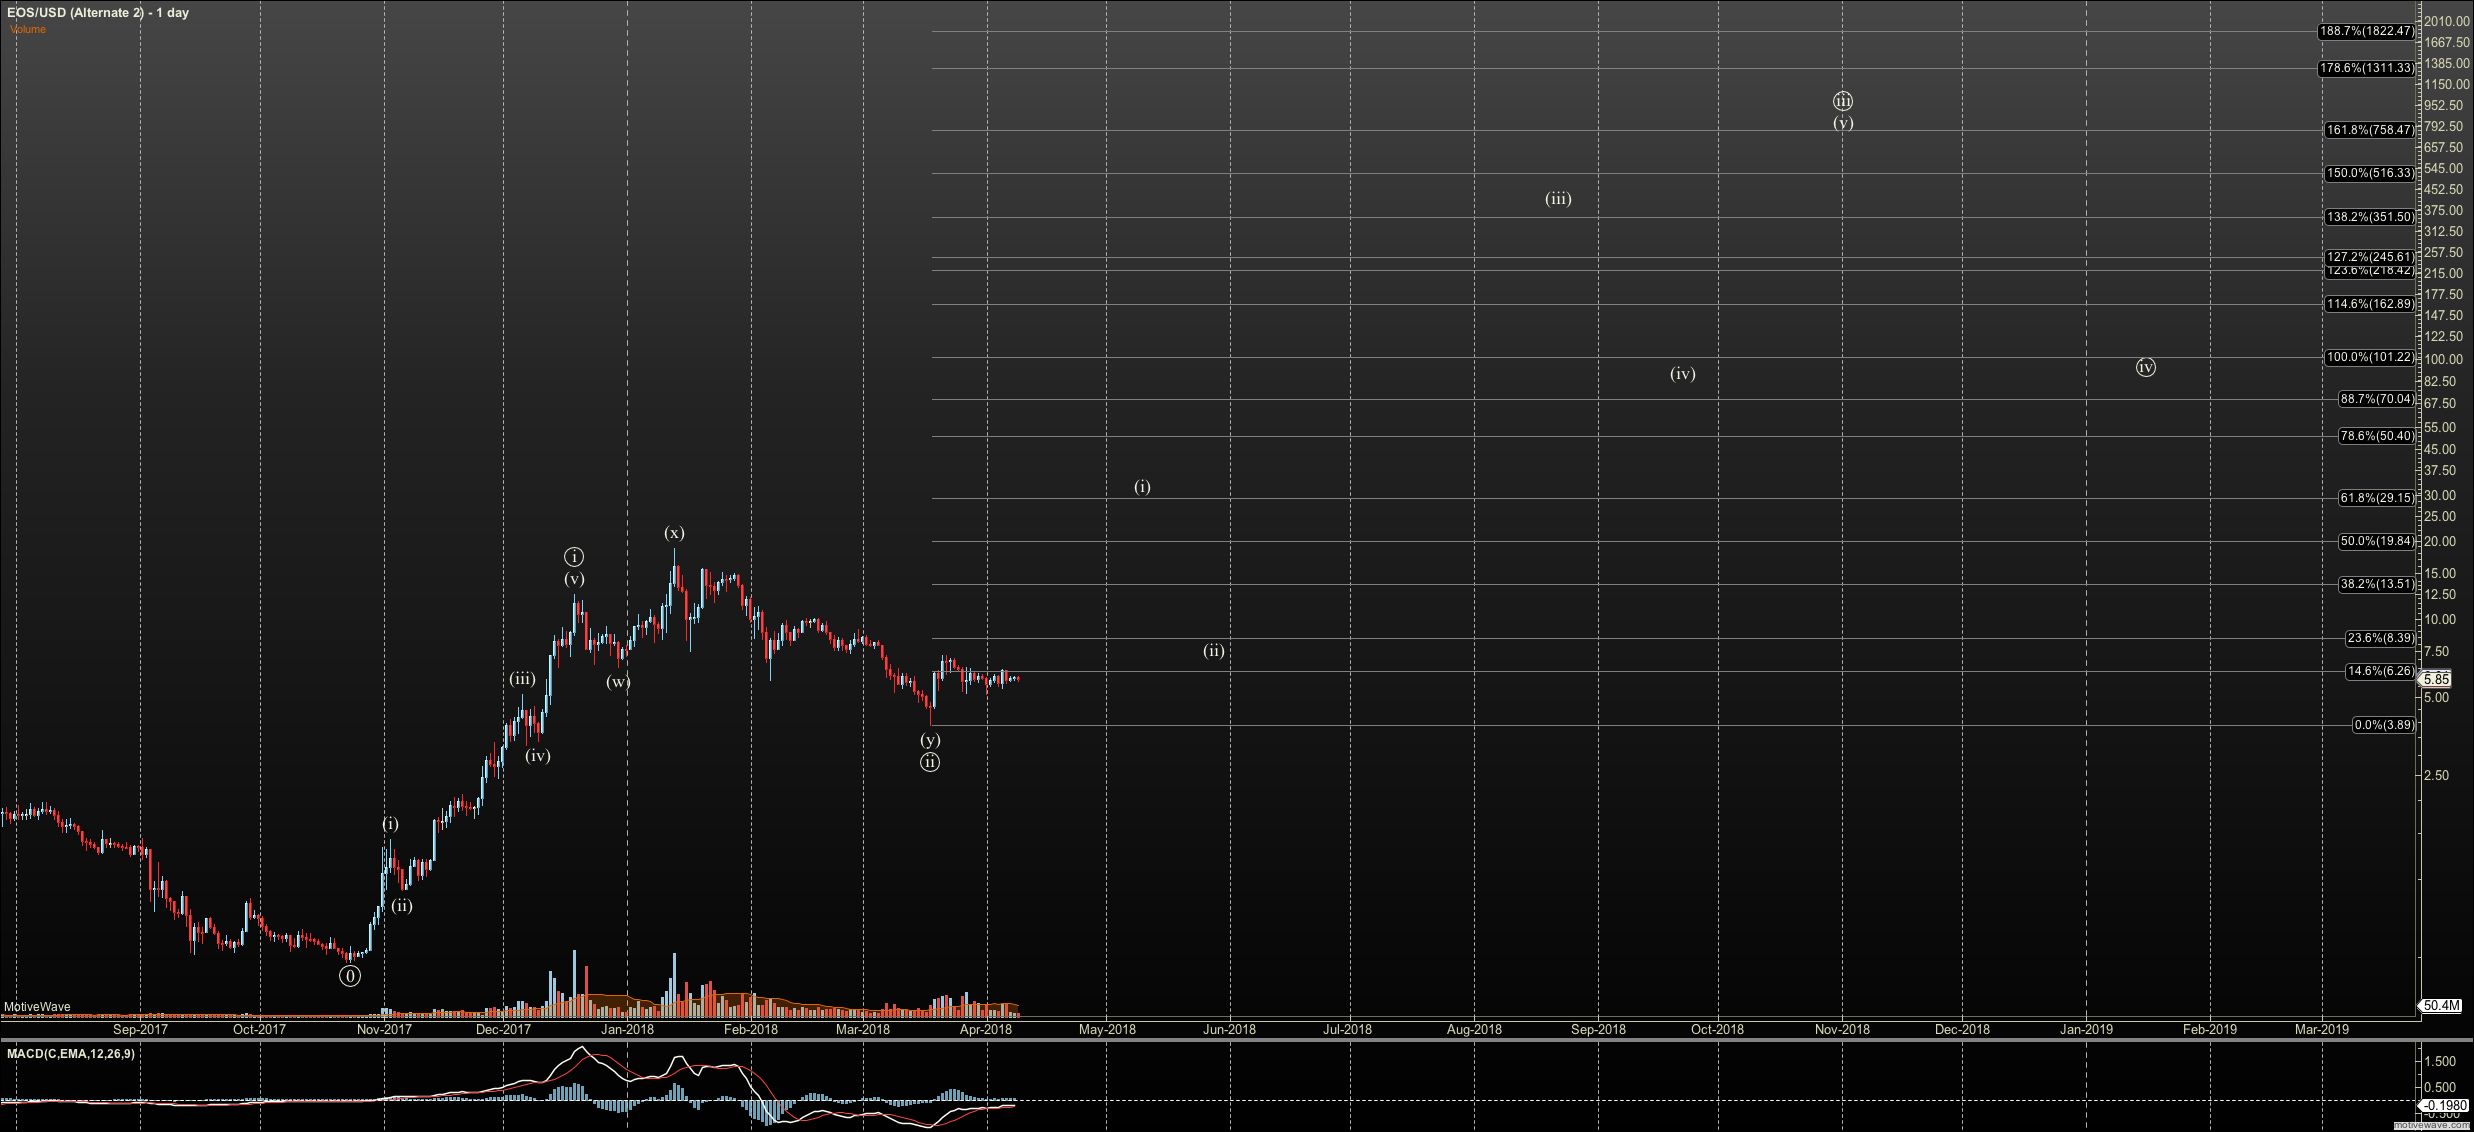
The first view is that EOS completed five waves between its October 2017 low and December 19 with a high of $12.46, where the current correction started. While it did see a slightly higher high after $12.46, it was corrective in structure so I’ve labeled it (X) in the chart below.
So far, we’ve traced slightly more than 38.2%* of the entire move off the October low. This is within range of a wave 2, but they often retrace to 61.8%* of the preceding 5 waves. This means that while we are structurally near a bottom, we may see an X wave rally before a lower low, that ideally holds the 61.8%* retrace point at $1.67.
If this view is confirmed as correct, a five-wave rally to $29.11, marked (1) at the 61.8%* extension of waves 1 and 2, would suggest that our larger wave three has started. The current target for that wave is $755. Further, if we see a rally to $29.11, we would expect EOS to hold the price of $8.39 thereafter.
Wave Four
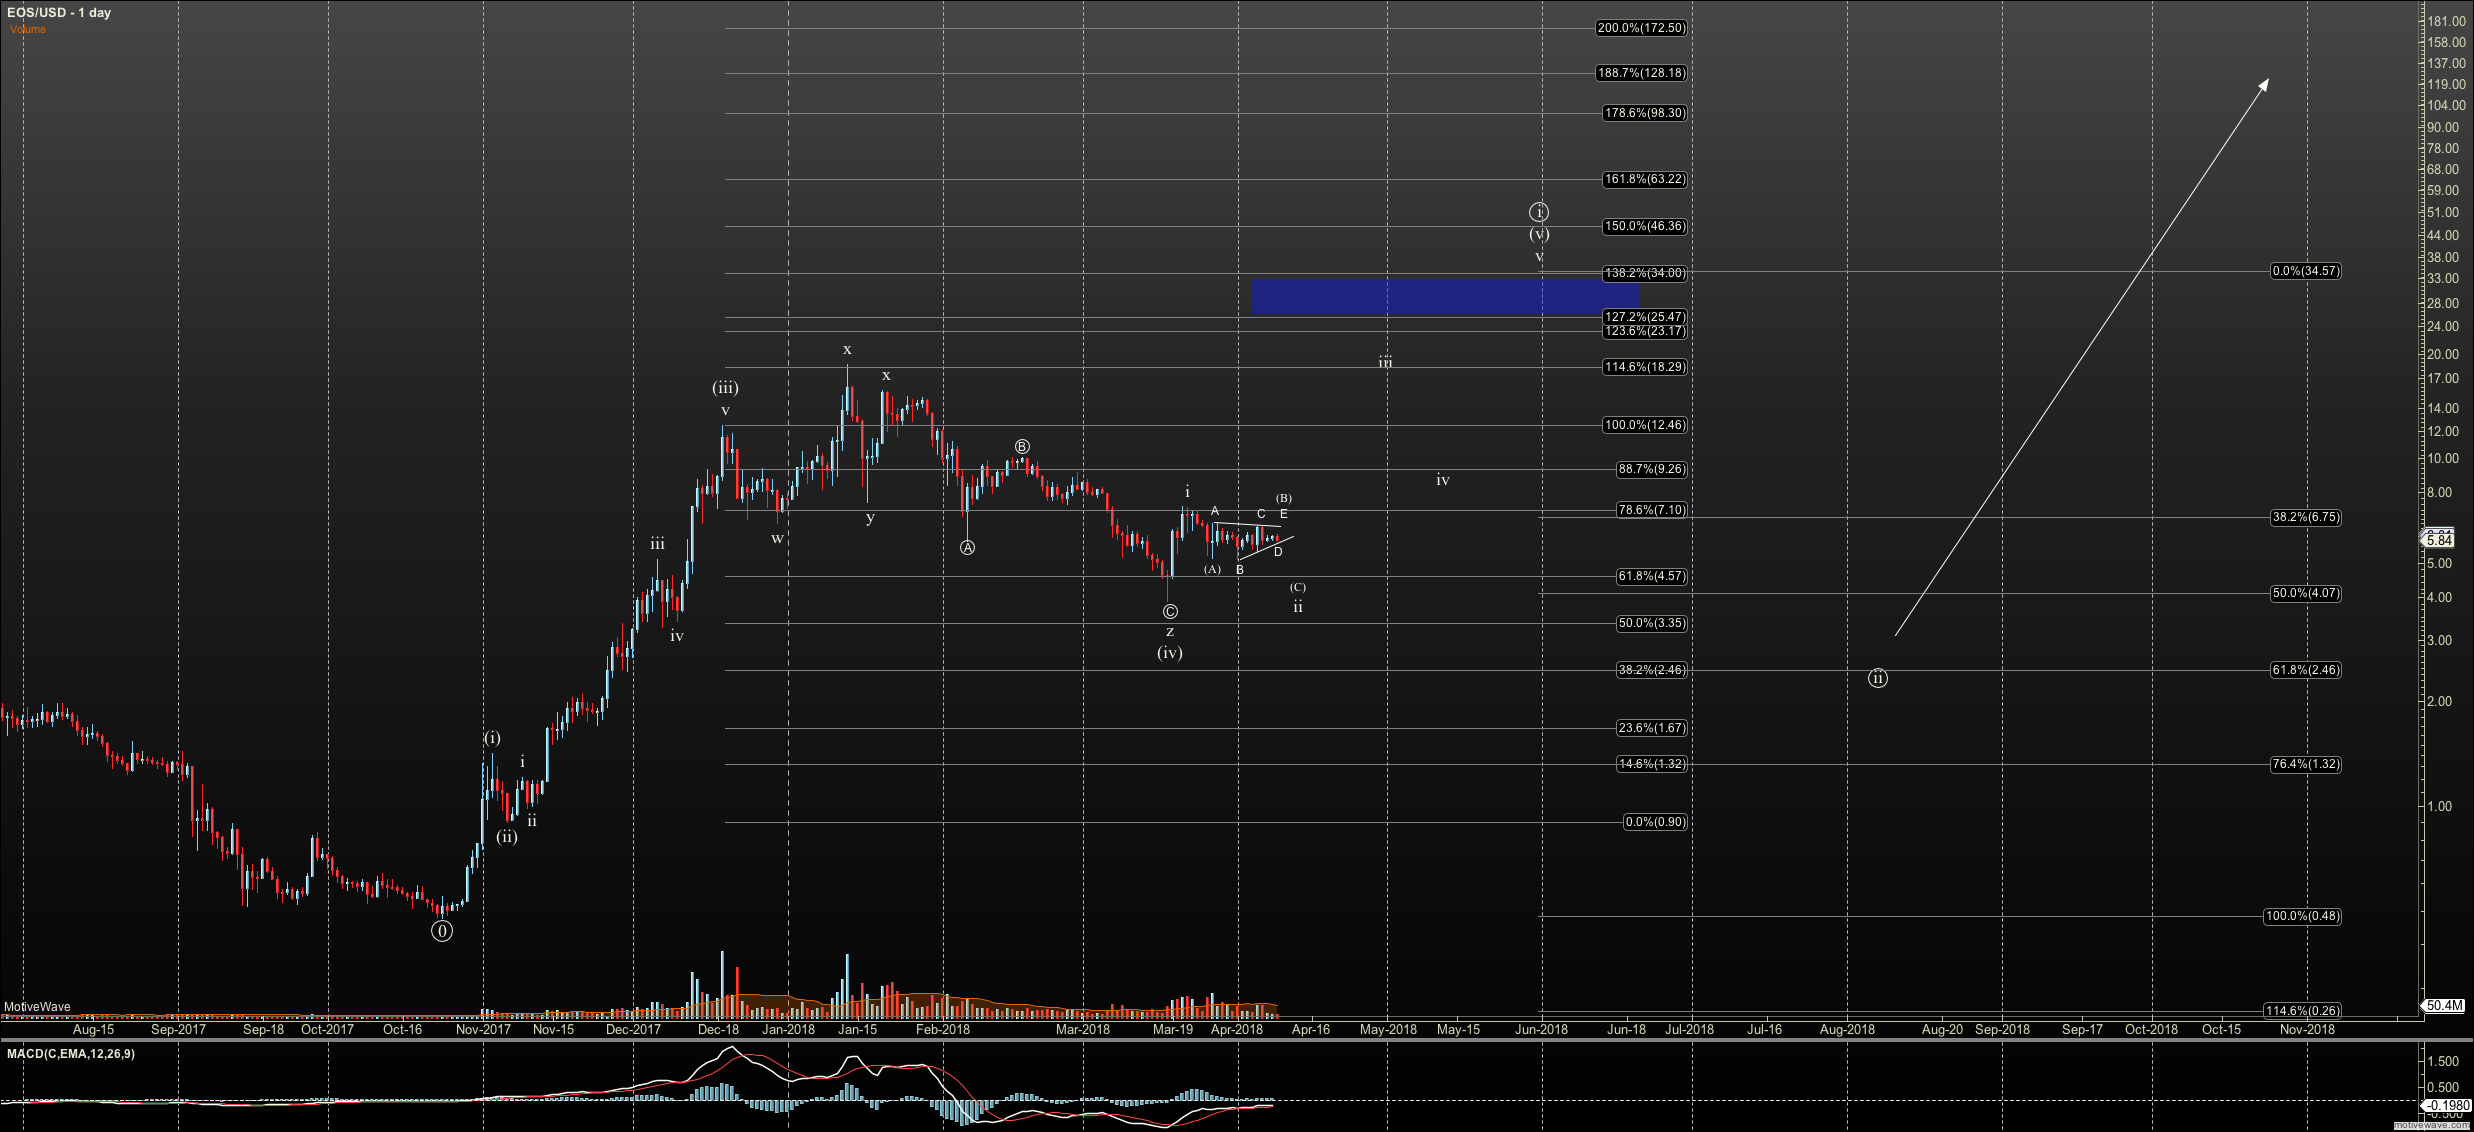
In our second viewpoint, EOS had only a three-wave rally into December. Just as in the previous view, we see this correction near completion structurally. However, it has already tapped the bottom of wave iv support so it must rally to new highs out of this level or we will view this as the wave two scenario above.
This view suggests a rally will take hold, reaching as high as $34. However, because that will be a wave 2 top, we can see a retrace from that level to as low as $2.40, or 61.8%, before the larger wave three begins.
This second view fits quite well with the view we have of many cryptos, that the next major top will be much larger in magnitude than that of December 2017 to January 2018.
Conclusion
The EOS project may well prove to be a competitor to the ethereum (ETHUSD) platform, but no one will know for sure until the project is complete and running.
As we wait for the great release, we can take a view on where price is going with Elliott Wave theory.
While six months of price action is not much history, we currently have a bullish view. That bullish view will be challenged only by a break below $1.67, which is the 61.8%* retrace. We’ll have to check the action over the next few months to see if one of our two views above can be made primary.
*Note all retrace and extension levels use logarithmic equations, not absolute percents.
Bloomberg: Bitcoin, the biggest bubble in history, is popping.
Subscribe to Elliott Wave Trader here
More articles on cryptocurrencies on MoneyShow.com
The CFTC and virtual currencies
The risks and rewards of trading cryptocurrencies
Trading Lesson: Decrypting the cryptic cryptos
Trading Lesson: Decrypting the cryptic cryptos: Many questions, few answers
Trading Lesson: How I learned cryptos and became the Ethereum Whisperer
As regulators come for crypto criminals, invest in what is real


