
If this were a courtroom, I would be the prosecuting lawyer against the bullish case for the stock market. Lately, I’ve presented ample evidence for a market that is starting to roll over. Want more evidence? Jeff Greenblatt asks.
On Wednesday morning the Dow (DJI) was up 286 points but all those gains evaporated by the middle of the session.
This is not the kind of behavior traders/investors should bank on.
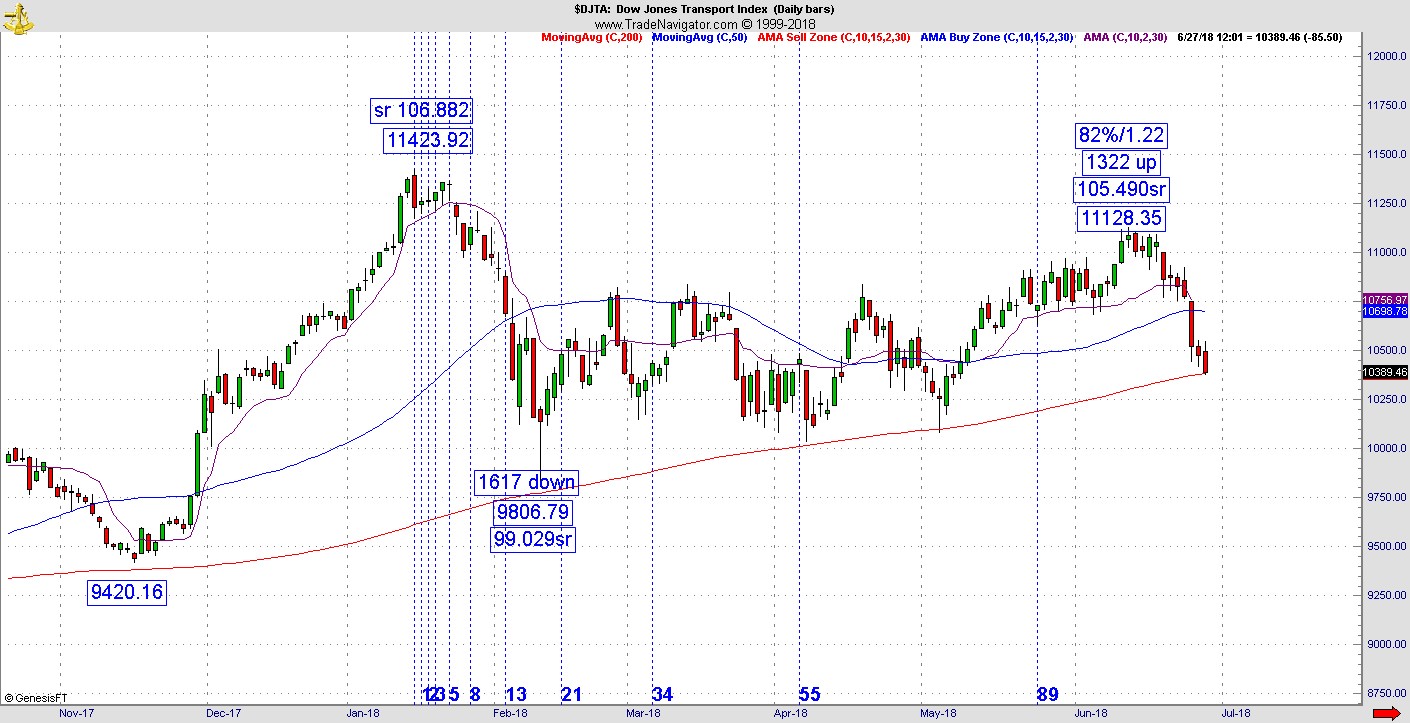
There have been many clues. While tech has gone to new highs, the Dow has sorely lagged. Now even the Transports are getting in trouble. Like the Dow, the Dow Jones Transportation Average (DJT) is in the midst of its third test of the 200-day moving average right here.
How many more times can market players go to the well? The problem is most people think the market’s river flow is never ending, just like the Mississippi. But eventually it turns into a game of musical chairs. I just want to be sure you are not the one standing when the music stops.
On Monday the Transports followed through on the latest pivot. This one being a Kairos 2.0 set up which was an 82% retracement off a square root at the high of 106.882.
What is a Kairos 2.0 reading? It’s one where the square root vibrates with one of my Kairos 1.0 readings like a retracement value in some way. In this case, there is also a Kairos 1.0 reading where the leg of 1617 points down is 1.22 of the 1322-point leg up. Last year I showed you how a retracement value can be just about any number other than the default readings on most software packages. Now I’ve uncovered how a square root can line up in the same way. This is next-level stuff.
In summary, the Kairos readings I’ve discussed recently in the HGX, CAC and FTSE are all working nicely and the bearish case has grown in recent days.
The only condition that has not worked to the downside are interest rates which finally found a level on the downside test to hold. That means the bear market rally is finally confirming. Imagine the stock market continues to get hit despite the fact this is a relief rally for interest rates. What does that tell you?
There are many issues the market must wrestle with. We’ve discussed bigger mass crowd psychology indicators in recent weeks like hemline indicators and peace agreements. Now we are dealing with political social unrest again. Markets don’t like this sort of thing.
The politics of division are going to new levels and as a market historian the lesson is the market topped in the late 60s the last time we were so divided. From the 1966/68 peak, the Dow bear didn’t end until December 1974.
This was an era that witnessed multiple assassinations, an unpopular war in Vietnam and the unseating of a U.S. president in the Watergate scandal. All of this spawned a super high interest rate environment which did not resolve until the 1980s.
If that’s not enough I can take you back to the late 1930s where the historical events leading up to WWII stalled the Dow enough that it put in a final high a few weeks after the start of the war. That’s why I quoted Lord Rothschild in this space last year as he claimed we were living in a 1937 environment.
Going forward, the end of the quarter is usually seasonally bullish but not always. The early part of July around the holiday is usually bullish as well.
Beyond that the next important time window is the middle of July which will be 610 trading days off the February 2016 bottom. The Dow already peaked at the first 610 window back in January.
For those who have a decade or at least the Trump rally in your pocket, it’s time to lock those in while it is still convenient to do so.
The prosecution rests.


