
Last week I referenced Dandy Don from the early Monday Night Football broadcasts. The lights may be dimming but the party wasn’t and isn’t over yet. Stay as long as you can while the music plays but don’t be caught without a chair when it stops, writes Jeff Greenblatt.
The caveat wasn’t in the Dow Jones Industrials (DJI) that took out the Facebook (FB) follow through day to the downside, but in the NQ and technology which put in that great reading the beginning of last week.
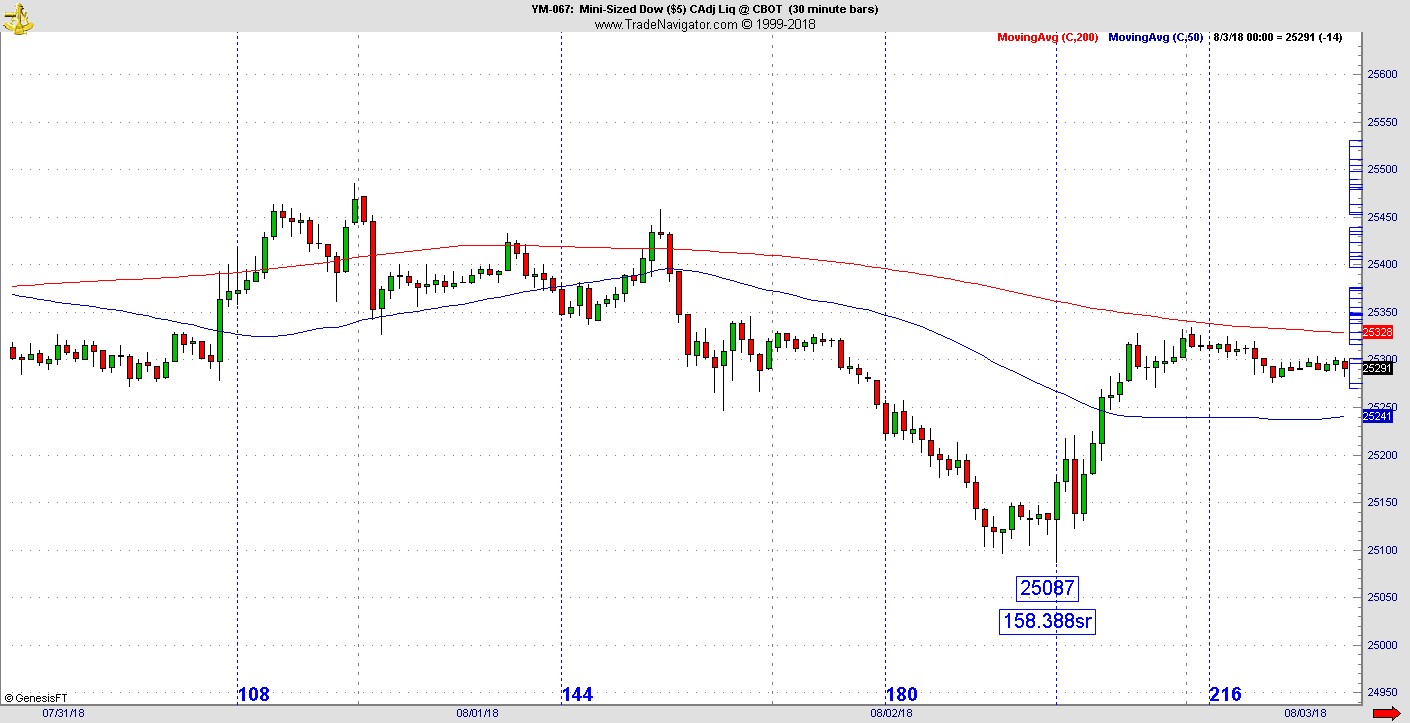
Not only was that low not taken out, the next morning the NQ did it again with another stellar square out 66 hours out from the 7166 low. On the same day that happened, the YM found a low of 25087 with a square root of 158.388. The vibration is 87/88.
It’s a simple chart, but the kind of reading that drives financial markets and Gann figured this out nearly 100 years ago. This sequence might be the closest U.S. markets have come to falling out of bed since at least Brexit and possibly the last correction in 2015.
While U.S. markets are sitting above their 618-day highs in many cases, do you want to know a market that has been nearly straight down since the first 610-day window when the Dow rolled over in January?
China, that’s right. The Shanghai Stock Exchange (SSE) peaked on January 29, right in line with the Dow top. Through Tuesday it was down nearly 25%! In the business media, a market down more than 20% is in a bear market. Traders knew it was lagging badly for a long time.
Additionally, this leg started going down the same time Facebook got hit, right on our 618-day window. Clearly, you can see who is getting the better of the trade battle going on between Trump and President Xi.
The danger for China is the SSE is retesting support from early July and that is the lowest point it has been at since March 2016. There is a very good chance the SSE has been in a bear market since the peak in June 2015 which just so happens to be the last time U.S. markets were in a real correction.
Our stock market was close to rolling over last week. If the SSE gets a push, it might become the proverbial snowball down the hill.
But there’s more.
Oil got hit very hard on Wednesday, partially due to the fact due to weak Chinese import data, according to CNBC. They also said while July imports rose slightly it was the third lowest reading of the year and they fear demand is dropping at Chinese independent oil refineries.
When it rains, it pours.
On the whole, sectors like the Transports (DJT) have done well lately. Even housing and banking have been higher at the same time. But if oil gets hit beyond Wednesday, it should start to impact the NYSE Arca Oil Index (XOI) which has been going sideways since May. If oil stocks get hit, then we have to start investigating these divergences all over again.
But what the trade war news is doing is sneaking up on people just when the market starts doing better again. The NQ calculations discussed here are very similar to the S&P 500 (SPX) reading after Brexit.
The difference is the rally is progressed two years down the road and markets have been tired. We haven’t even talked about interest rates yet. The crowd has yet to wake up to that Dow down 400-plus day due to interest rate concerns.
The long bond rally peaked on July 6, that’s now more than a month ago. They are one distribution day away from those concerns manifesting to the surface. Yes, the market has been better but this is not the time to be complacent.
Try to stay as long as you can while the music plays but don’t be caught without a chair when it stops. What that means is protect profits from the past two years and if you are initiating new long positions, put in tight stops.
August is traditionally the vacation paint drying month of the trading year. September is statistically the weakest link.
Suddenly, it’s only three weeks away.


