
Traditionally, the arrival of Thanksgiving marks the proximity of the Santa Claus rally on Wall Street. And while this year may turn out to not be different than most years, a lot depends on the Federal Reserve, the bond market and the price of crude oil, writes Dr. Joe Duarte Sunday.
You know this time is different when the Federal Reserve’s chairman Jerome Powell admitted the global economy may be slowing and the vice chairman suggested the central bank may consider a neutral bias toward interest rates within one day of one another last week.
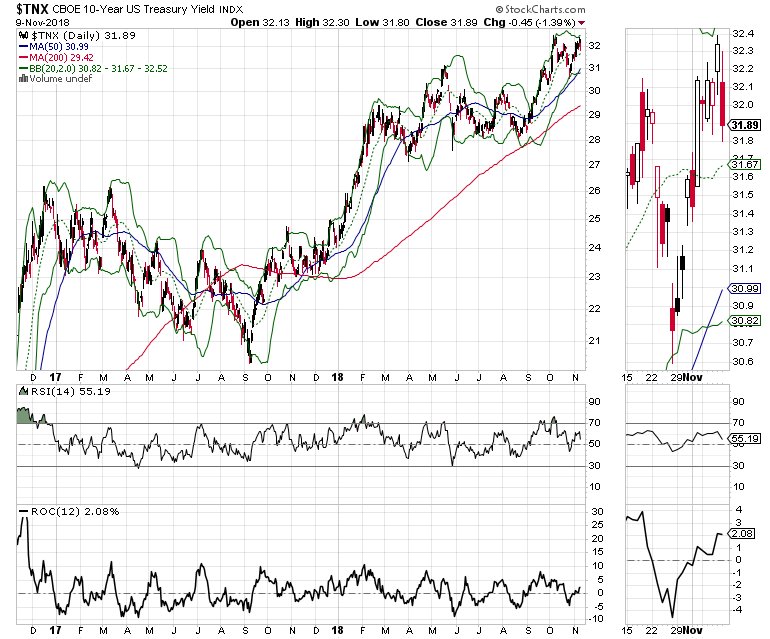
The big winner of the Fed’s latest pronouncements, unfortunately for stock traders, has been the U.S. Ten-Year Note yield (TNX) – see below for full details – which I noted last week was close to a decision point given the potential for a slowing economy.
And while it would be welcome news if the Fed took a break from their quest toward higher interest rates, there is still a great deal to sort out in this market where significant technical damage has occurred. Furthermore, the big question is whether the Santa Claus rally is even within the cards at the moment given the landscape.
This is a valid and significant question to consider as there are four troubling fundamental issues at the moment whose next moves could well hold the answer to the Santa Rally question and perhaps what happens in the stock market in 2019:
1) The number of air pockets in stocks that misfire is rising. Think Network Appliance (NTAP) and Nordstrom (JWN).
2) An increasing number of companies are giving poor guidance for future quarters. Think Nvidia (NVDA).
3) When the bond market signals the Federal Reserve that it disagrees with the central bank, and the central bank seems to pay attention before all hell breaks loose beyond repair, you know you are leaving the Twilight Zone and entering the Outer Limits.
4) The relationships among bond yields, crude oil prices and the stock market is signaling caution.
Market breadth gropes for support
I’ve been watching the New York Stock Exchange Advance Decline line (NYAD) for liquidity clues in the stock market for many years. Moreover, this indicator, as the chart below shows has been particularly accurate in predicting the general trend of the stock market since the 2016 presidential election, which is why its current posture remains concerning while providing a slight glimmer of hope for the bulls.
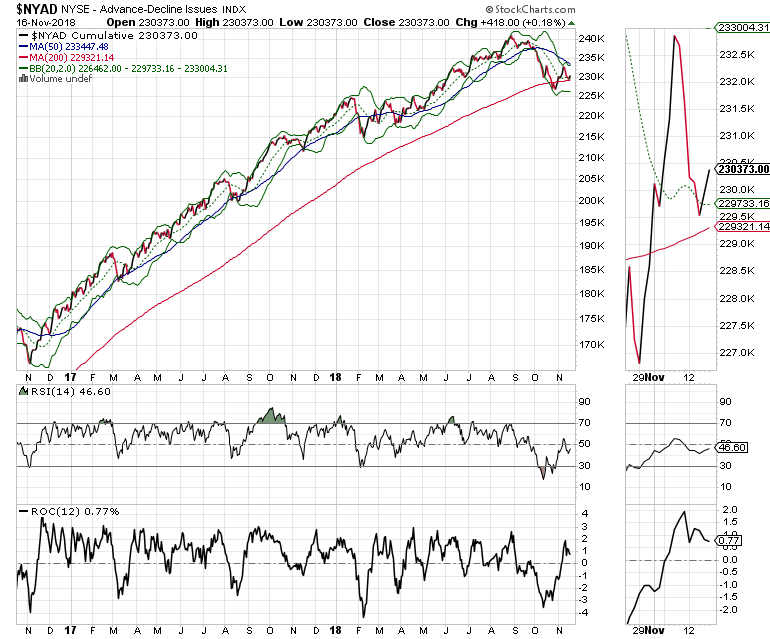
And while last week’s failure to rise above its 50-day moving average is concerning, NYAD managed to end the week on a positive note. Still, there is the rolling over of the ROC indicator, which measures momentum which is diverging from the RSI which like NYAD seems to be trying to recover.
What’s left to see is whether the NYAD can hold above its 200-day moving average and use the average as support point from which to launch a credible intermediate term rally. If the NYAD breaks below its 200-day moving average decisively and it extend the decline below the key line I would expect yet another painful down leg in stocks.
Moreover, the relationship between rising interest rates and falling stocks has never been clearer. The chart of the U.S. Ten Year bond yield (TNX) shows that market interest rates have risen significantly in the past 12 months. And while stocks managed to continue their rise for most of that period, once yields crossed above 3.10% convincingly, all bets were off.
Nevertheless, this market still has a fair amount of work to do as the drag on NDX from the FAANG stocks MicroSectors FANG+ 3x Leveraged ETN (FNGU) is still sizeable and could linger for a while.
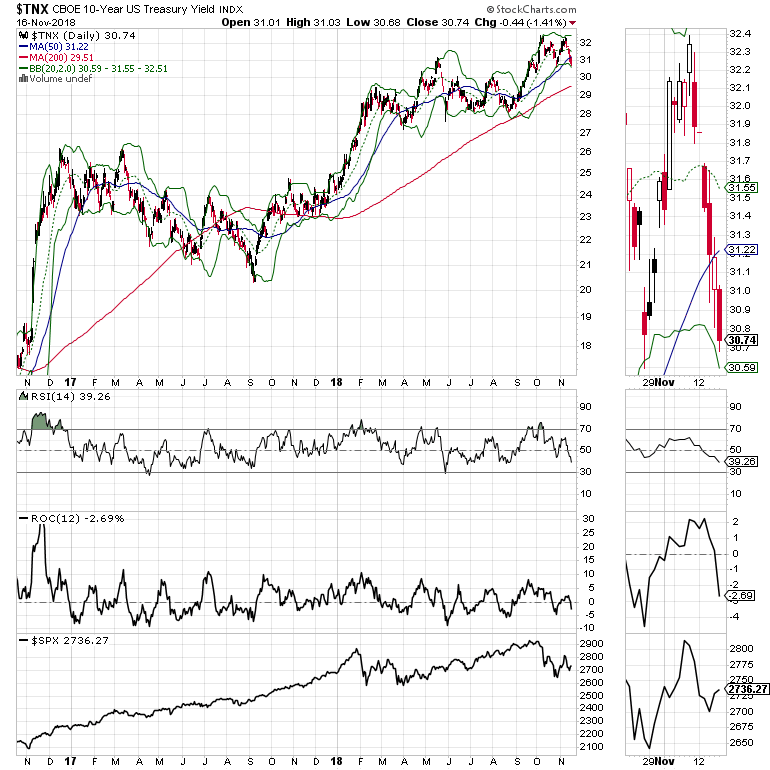
Perhaps the most important chart pair of the moment is that of the U.S. Ten-Year Note (TNX) and the price of West Texas Intermediate Crude (WTIC).
TNX shows a fairly abrupt drop in its yield seemingly moving toward 3%, signaling that the bond market is betting on a slowing economy.
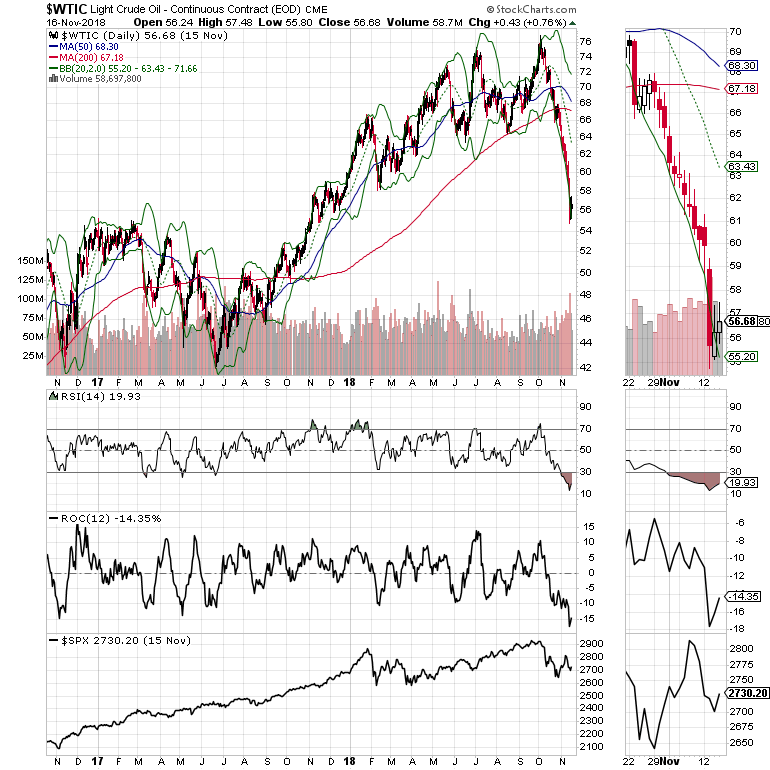
With regard to crude oil, aside from its complete price crash and burn, note the excellent correlation within the last two years of the price in S&P 500 (SPX) and WTIC.
This suggests that if and when a bounce in crude oil arrives, we may see a more credible and perhaps convincing rally in stocks. With cold weather moving in we could see a seasonal bounce in crude.
For Santa Rally to materialize, Oil will have to show signs of life
Seasonally speaking we are nearing the Santa Claus rally time of the year and given the oversold state of the stock market we may get something of a bounce. Still, there are lots of headwinds at the moment as the economy seems to be slowing and the Fed is becoming a bit of an intangible, especially if it decides to pause its current trajectory toward higher interest rates a break at or after its December meeting.
Technically speaking, the price action in the bond and crude oil markets suggest traders are betting on a significant slowing in the U.S. and the global economy confirming what the rising perception seems to be.
All said, the Federal Reserve’s recent comments, the price of oil, falling bond yields and the sluggish bounce in the stock market suggests that until proven otherwise, any rally in stocks will likely be fueled by a series of events which raises the price of crude oil.
However, if the Fed makes it clear that it’s taking a pause, and perhaps skips its highly expected rate increase in December and we get a bottom in crude oil, given the strong seasonality, we may actually get a surprisingly rewarding Santa Claus rally.
Disclosure: I own shares in HRL as of this writing.
Joe Duarte has been an active trader and widely recognized stock market analyst since 1987. He is author of Trading Options for Dummies, rated a TOP Options Book for 2018 by Benzinga.com - now in its third edition, The Everything Investing in your 20s and 30s and six other trading books. To receive Joe’s exclusive stock, option, and ETF recommendations, in your mailbox every week visit our website .


