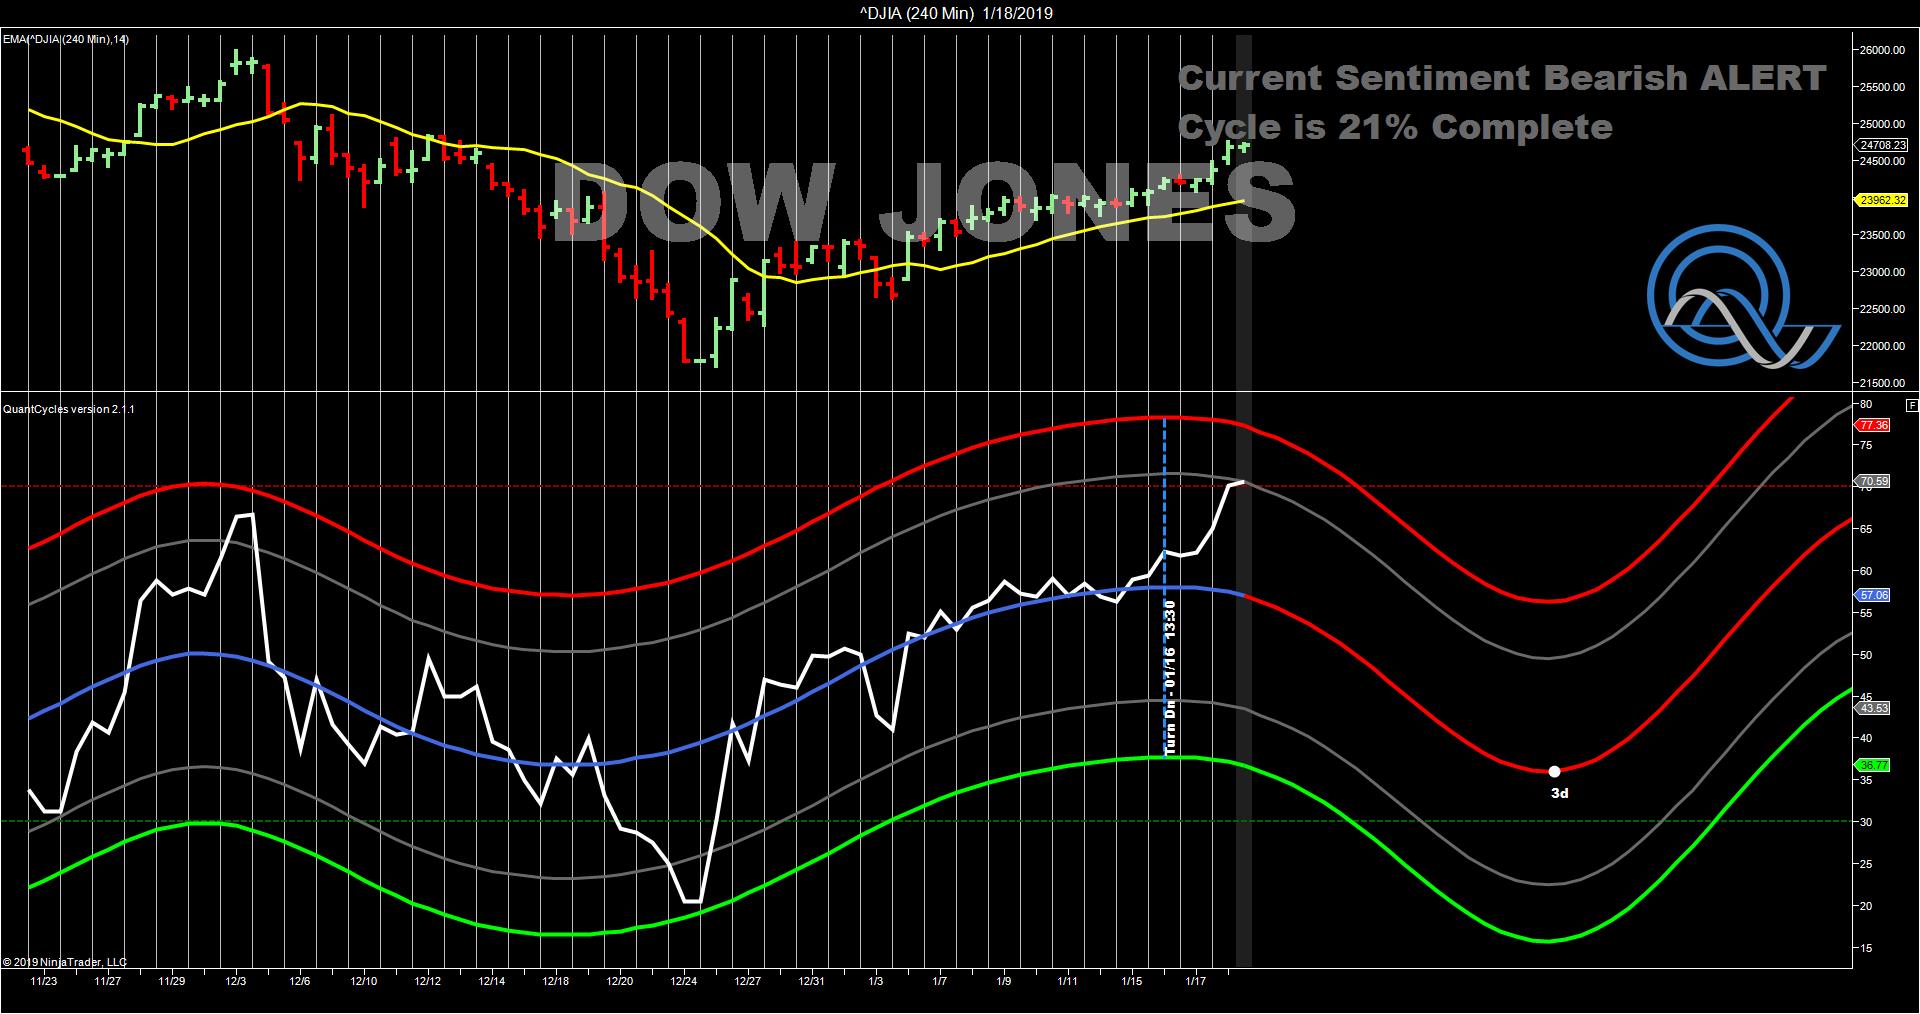
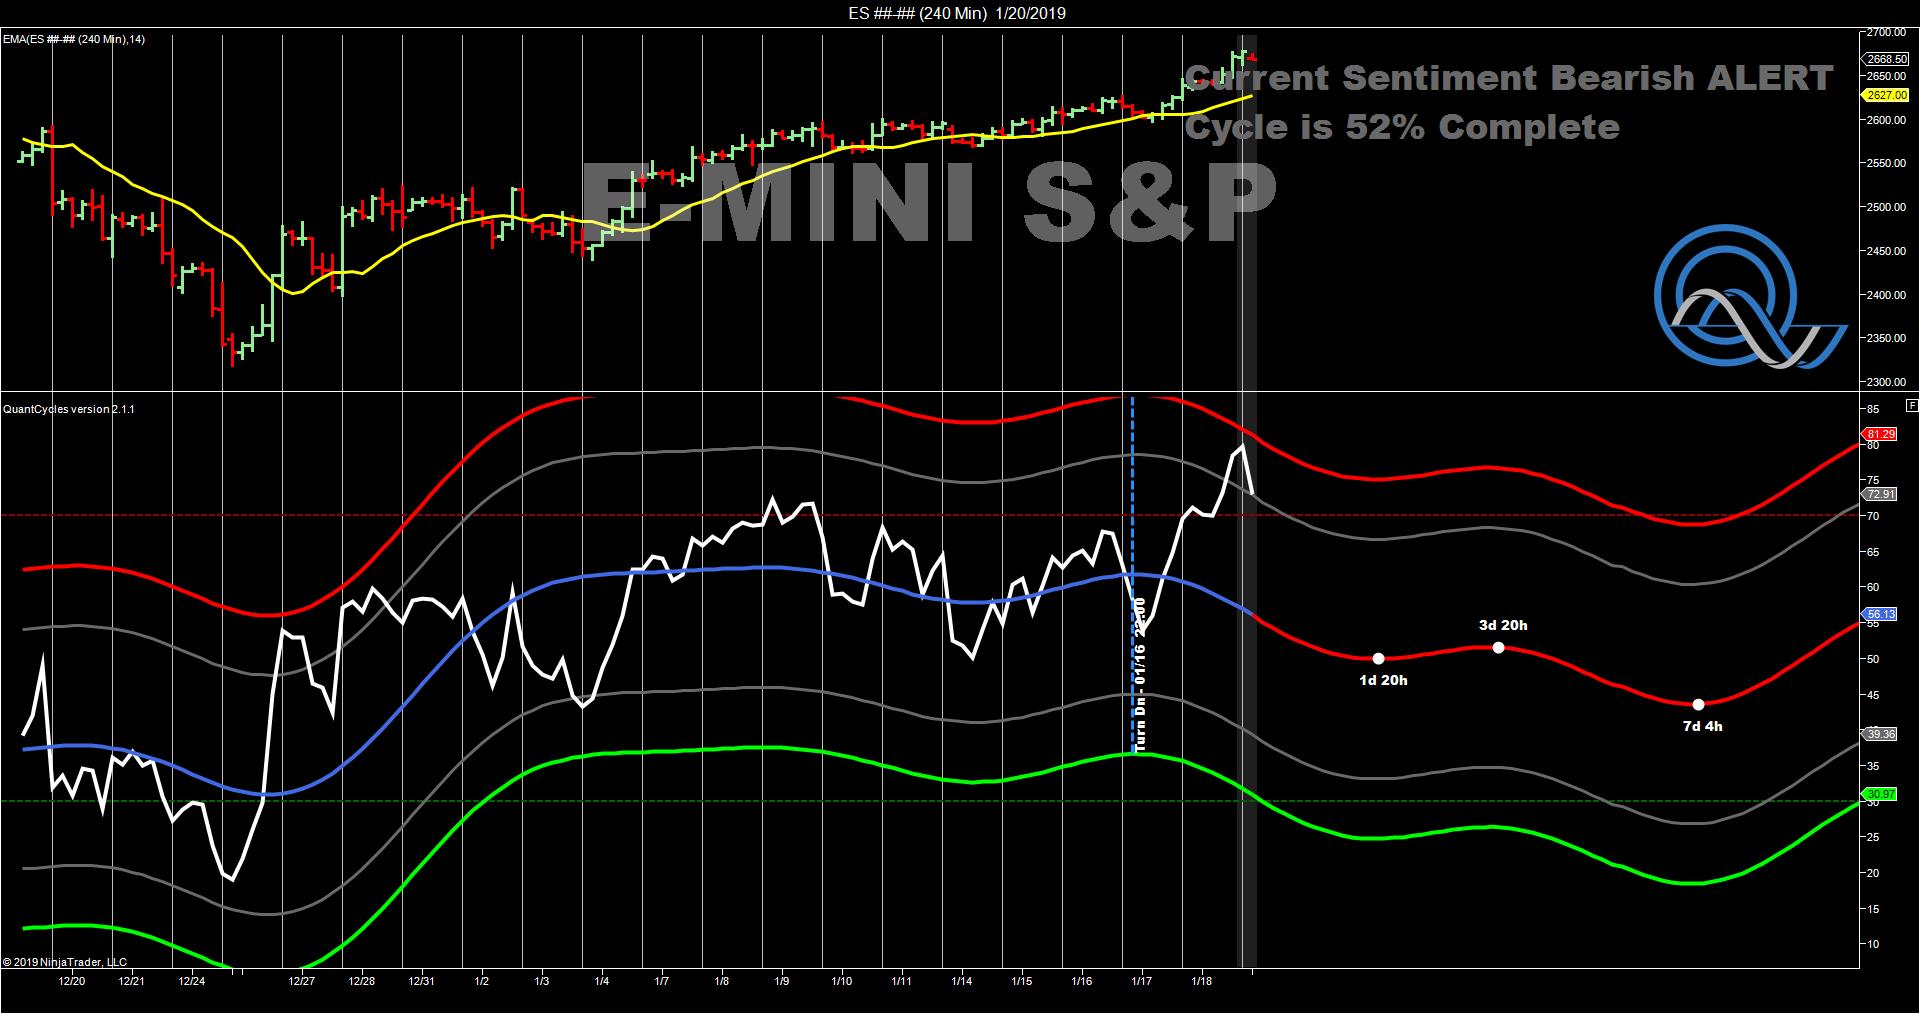
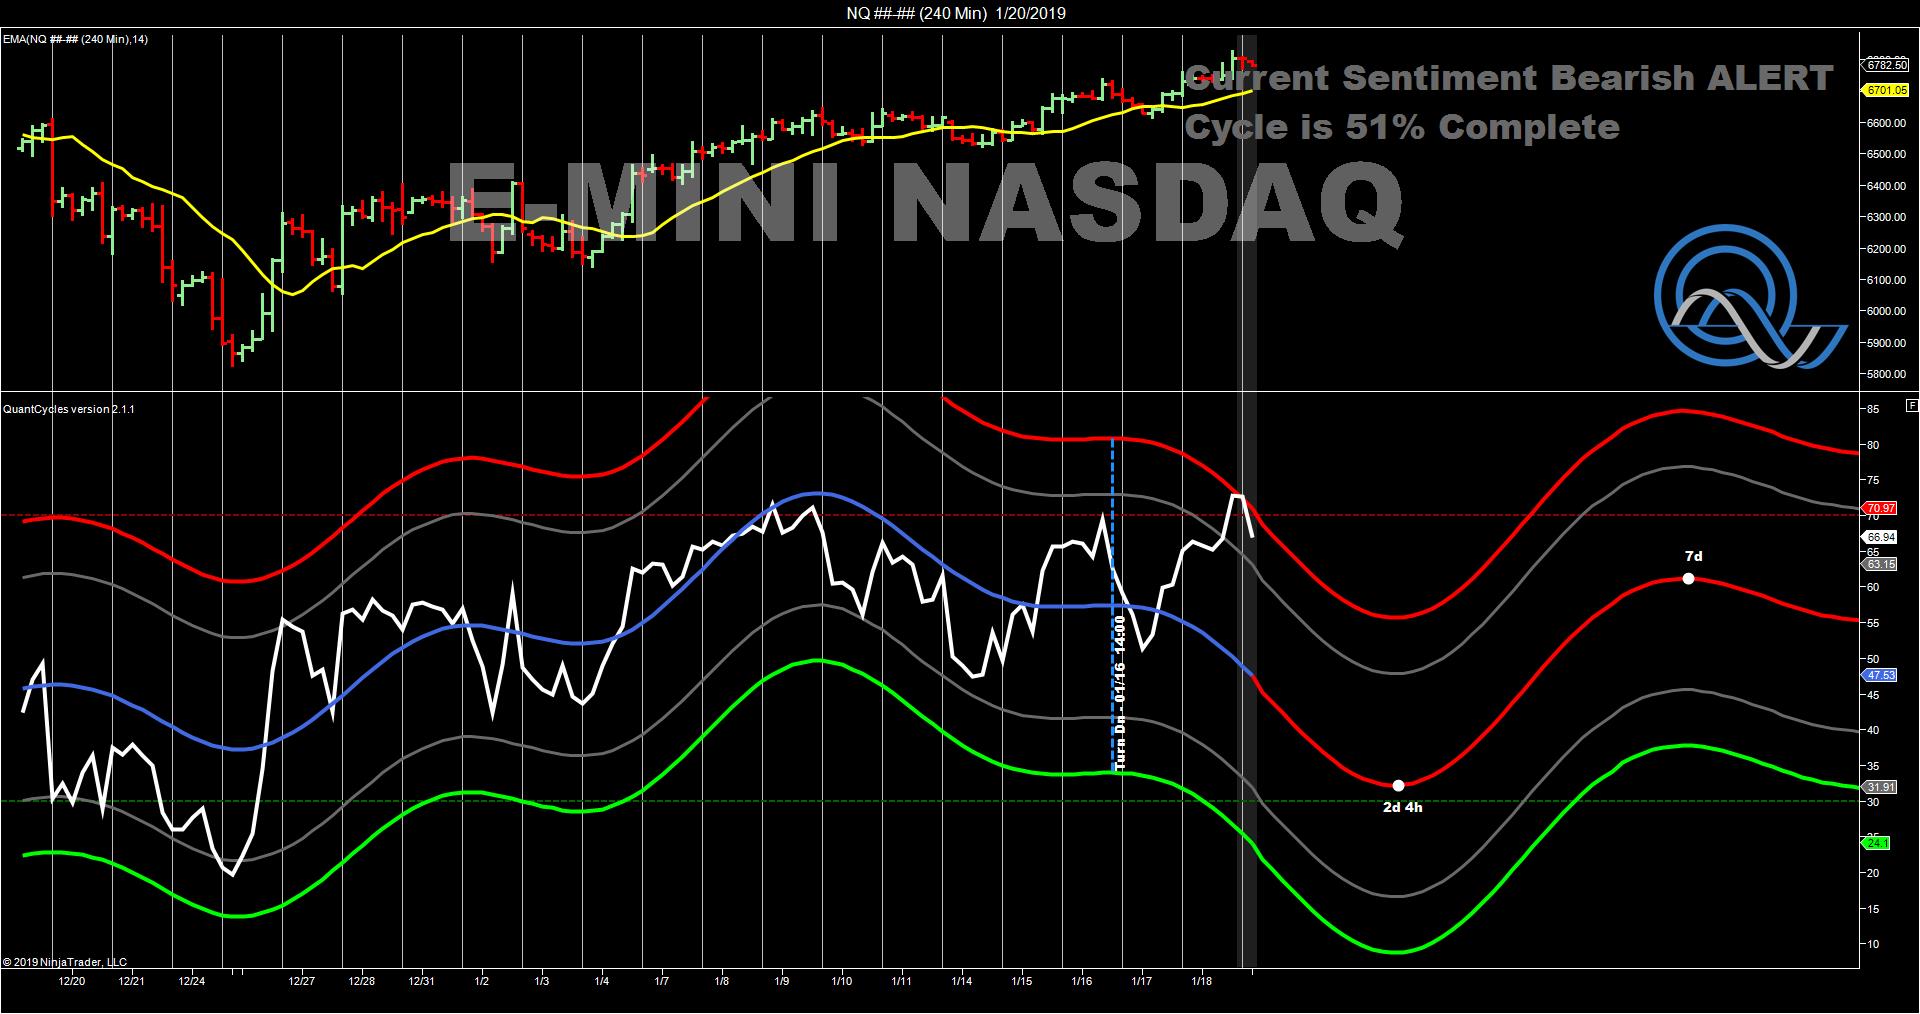
The QuantCycle Indicator is flashing a bright warning sign for the major stock indexes this week, says John Rawlins.
The QuantCycle Indicator is revealing a short-term consensus pull-back for all the major U.S. stock indexes. It is interesting because a lot of technical noise has been indicating the recent rebound in equities is running out of gas.
The 240-minute chart for the Dow Jones Industrial Average, Nasdaq 100 and all indicate short-term weakness.


The Nasdaq 100 appears to be the weakest signal, which is a confirmation of sorts because it has led the other indexes in recent years.
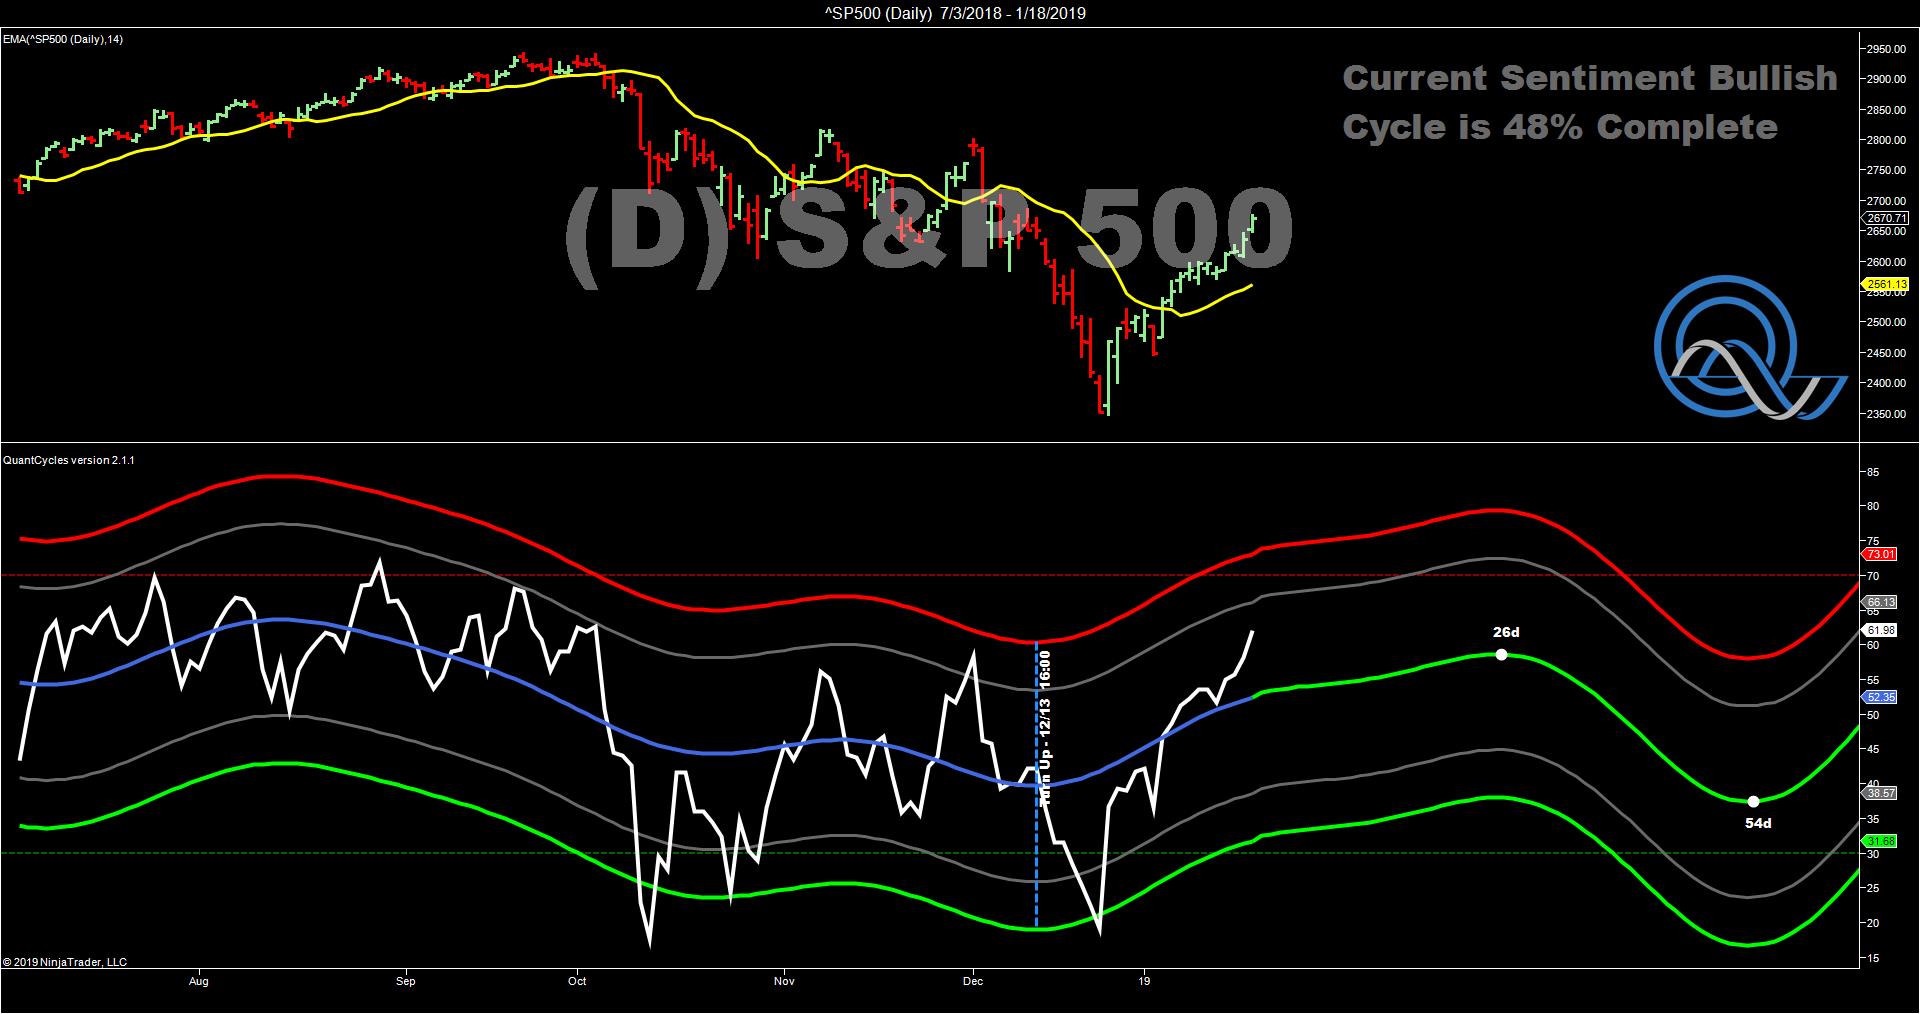
This is a short-term signal as the daily QuantCycle Indicator for the E-mini S&P 500 is still trending higher—though close to overbought territory—until April (see chart).

The QuantCycle indicator is a technical tool that employs proprietary statistical techniques and complex algorithms to filter multiple cycles from historical data, combines them to obtain cyclical information from price data and then gives a graphical representation of their predictive behavior (center line forecast). Other proprietary frequency techniques are then employed to obtain the cycles embedded in the prices. The upper and lower bands of the oscillator represent a two-standard deviation move from the predictive price band and are indicative of extreme overbought/oversold conditions.


