
Gann methodology is like an onion that needs to be peeled. The more you study, the more you learn.
For many years, disciples of W.D. Gann have taught his price and time methodology. Let’s say XYZ stock is trading at $50, simple Gann analysis holds that for this stock to square out it needs to move 50 points in 50 days, weeks or months. There are times when it will work out like this, but it’s rarely this simple.
For this reason, many traders have come to the conclusion that there isn’t enough meat to develop a strategy based on Gann’s time-tested methodology. While some analysts believe that Gann is no longer valid, they simply are not looking hard enough. Gann’s theories remain solid, they just need robust research to be exploited.
There are many variations of Gann’s methodology that could open up opportunities for those willing to do the heavy lifting.
Let’s start with an long-term example on a continuation chart for soybeans. The top was $17.94 in 2012 and it bottomed at $8.44 in November 2015 (see charts below). This is a range of $9.50 (950 points). It rallied to June 2016.
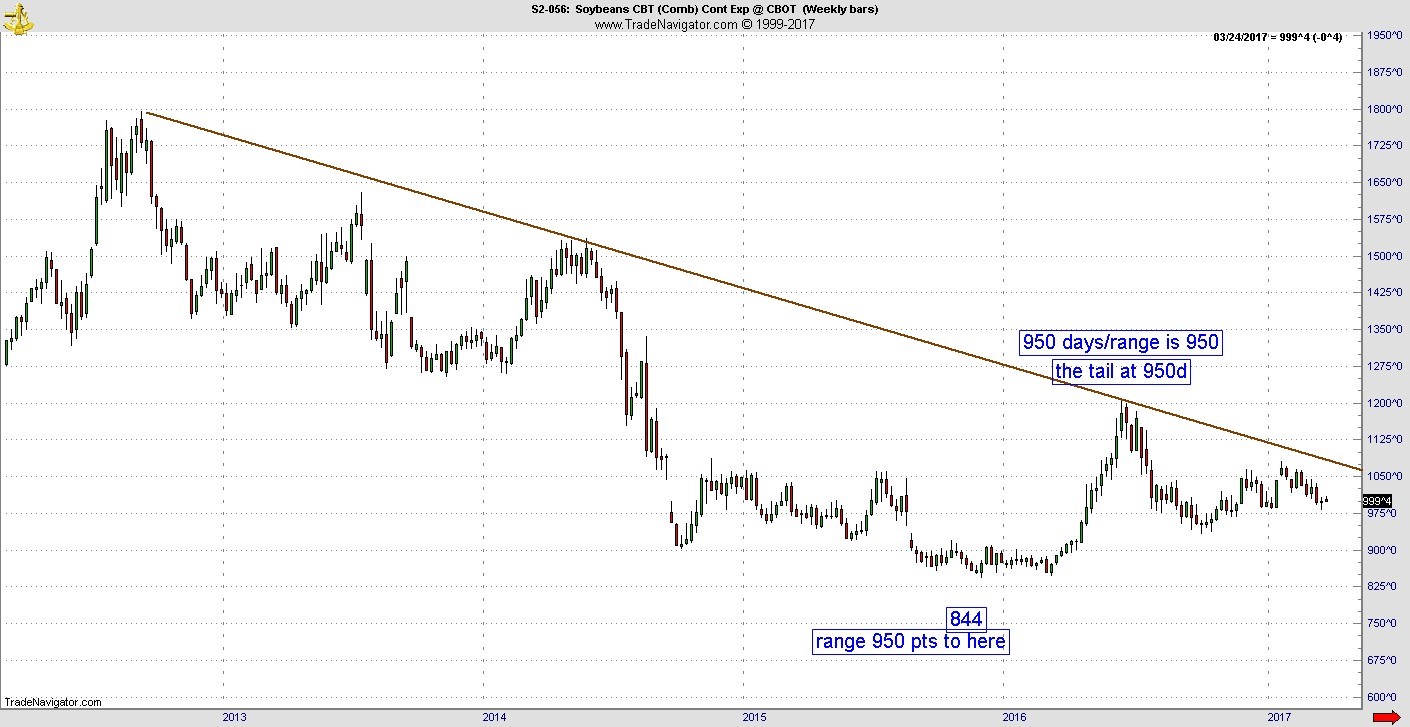
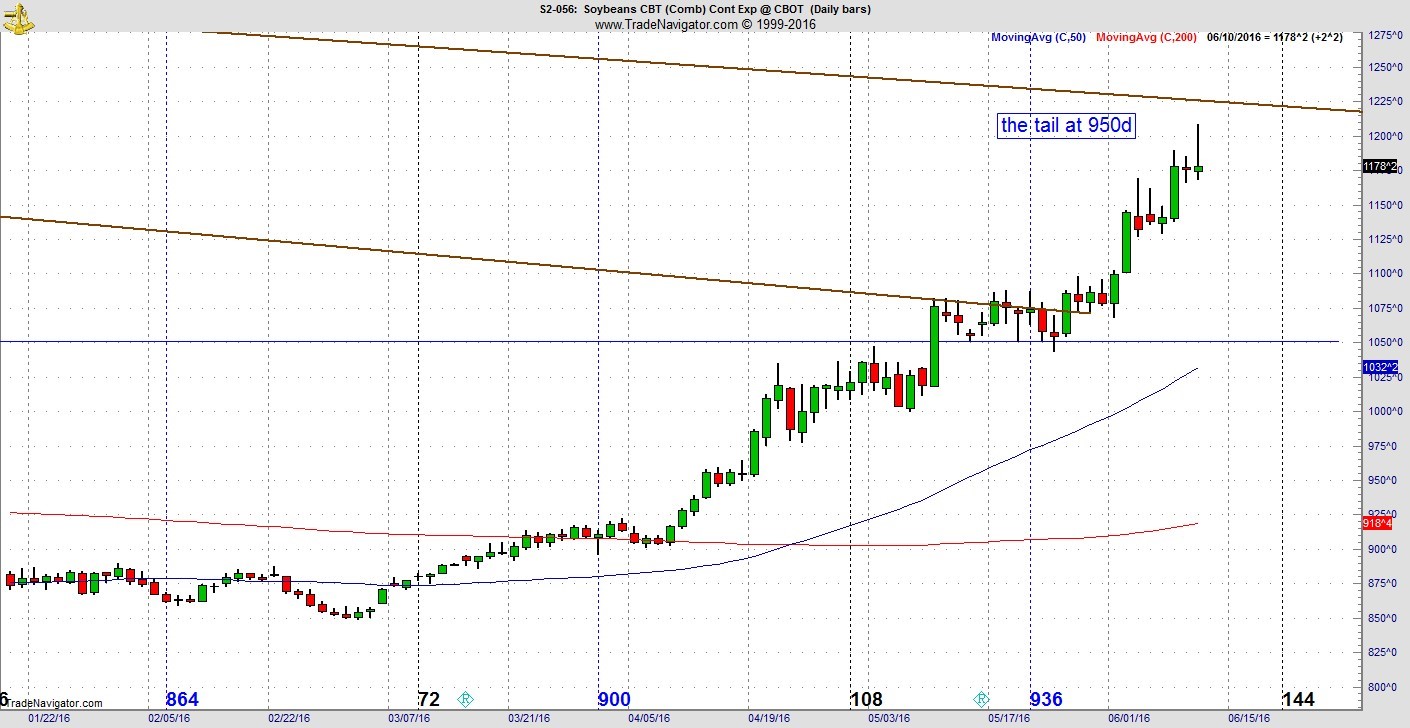
As it got close, for Gann enthusiasts, the rally was 920 days off the top, then 930. When it got to 940, odds increased price and time could actually square out at 950 days. You can see from the charts that that is exactly what happened. But the close on the 950th day — the price action left an upper tail. In the immediate aftermath, the price action dropped 20% the next two months. Price action never recovered for the rest of the year and still had a chance of going lower after another trading bounce late in the year.
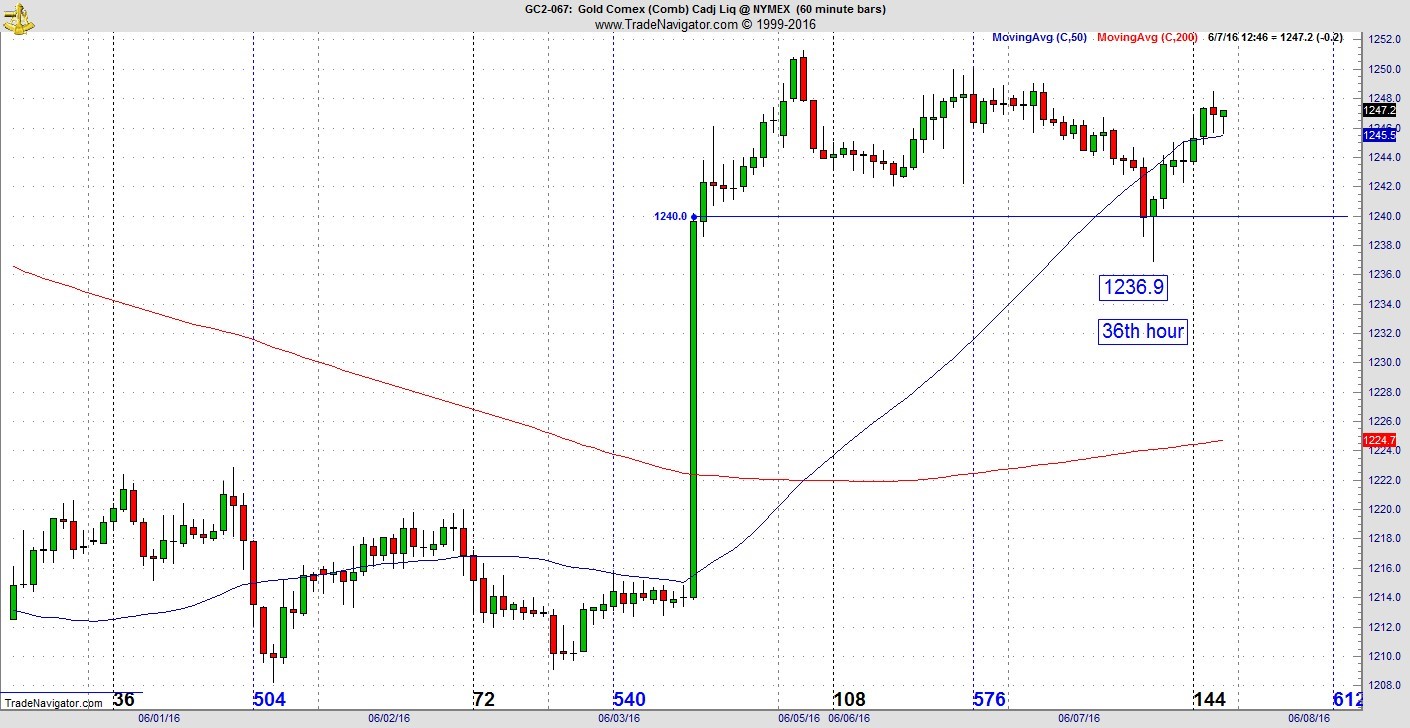
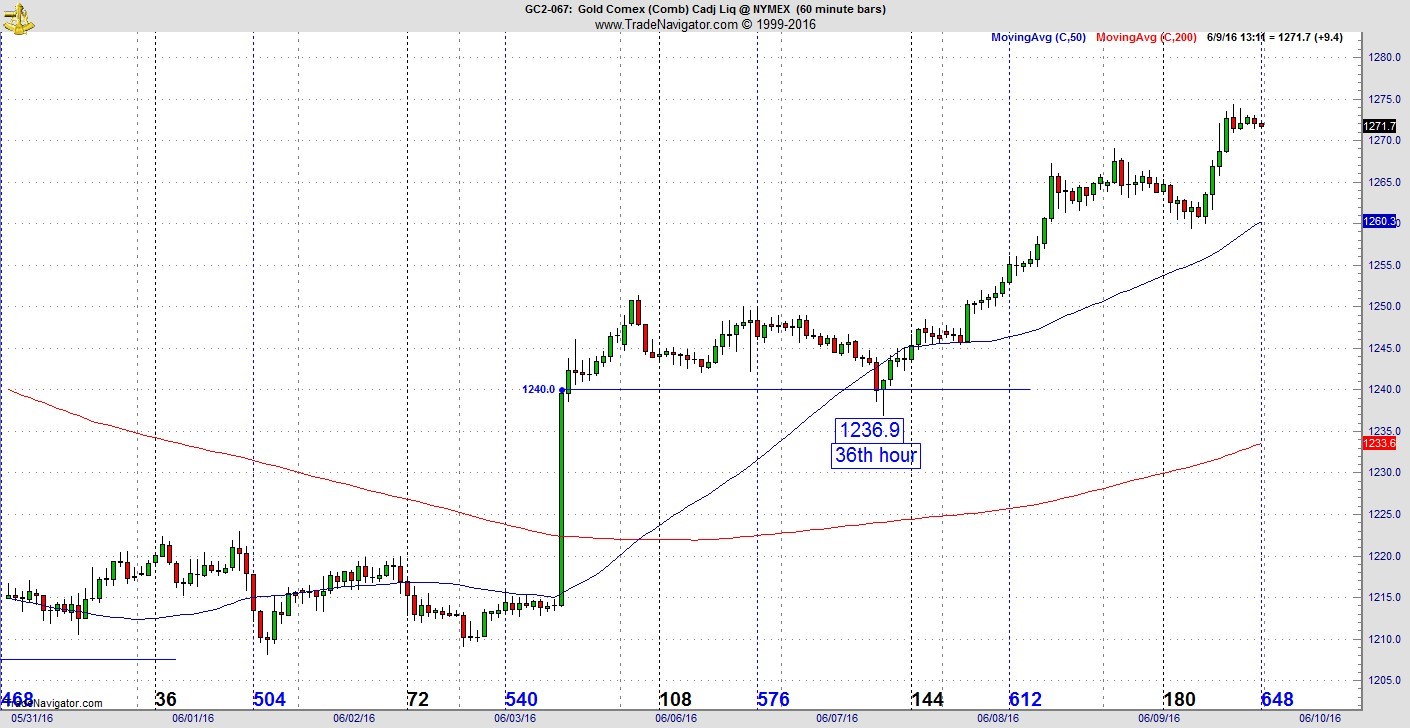
How can this be valuable to the average trader? Look at the hourly chart of gold from June 2016 (below). It’s just a coincidence this action materialized in June 2016 as well. Gold appears to be having an ordinary pullback that materializes on any chart with one difference. Price and time square out perfectly. This is a 36-hour pullback that stops going down at $1,236 per ounce. Price and time square outs can also be called a vibrational methodology because the chart ends up vibrating at a certain number. In this case it was 36. On the hourly chart, this was an excellent move of approximately 40 points over the next few sessions (see second chart).
Let's make a deal
When things don’t go well, traders realize something is working against them, but they don’t know what that is. One of the conditions coming against traders is an unexplained variation or variable change. Unexplained variation is taken from a statistical formula called the sum of squares. Unexplained variation is part of a mathematical model that allows for variation within a defined data set that takes into account the total variance present within the process. The unexplained variation uses regression analysis. Most statistical models are known to be linear math. However, the movie 21 brought to national attention the Monty Hall problem from the popular show “Let’s Make A Deal.”
For the contestants on that show, they are given the choice of three doors. Behind one door there is a car and the other two contain a goat. What is the contestant's chances of picking the winning door? In a basic statistics course, the odds would be 33%. Let’s say door number one is picked. Monty Hall, who knows where the car is, opens door number three. A goat appears. Monty Hall offers the contestant the chance to switch doors. The question is whether it is to the contestant’s advantage to switch his choice to door number two. Overall if he doesn’t switch the chances are 33%. But if he switches the odds go up to 67%. Why is that?
There is a lot of controversy about this if one reads all the threads under this topic. Even after this complete problem with all the solutions appeared in Parade magazine in Marilyn vos Savant’s “Ask Marilyn” column in 1990, nearly 1,000 PhDs wrote in to claim vos Savant was wrong. The reason vos Savant is correct is because of the behavior of the game show host, who knows where the car is and allows the contestant to switch at key points in the game. You can follow this up on the site Marilyn vosSavant.com/game-show-problem. That is what converts a linear problem to nonlinear, which is what financial markets are. It’s the value of new information.
Why is this important to the trader? Simply put, what the trader does not know will hurt him. Price and time vibrational work will allow the trader to deliberately reduce the odds of what is coming against him. To be clear, there are many more possibilities given there are 100 numbers potentially on the price handle side (using last two digits) and the time side. For instance, a price that ends in 64 can match at 64, 164 or 564 time units.
Linear vs. non-linear
In a nonlinear world, unexplained variation can never be reduced to zero, but one can figure out how not to go against the grain. There was a potential breakout in the Biotechnology Index (BTK) on an hourly chart in 2016. On the gap, it appears it will break out. But the breakout fails and cuts very quickly, likely too fast for the average trader to realize what happened before it ended up under water (see chart below).
Tomorrow we will provide a current example.
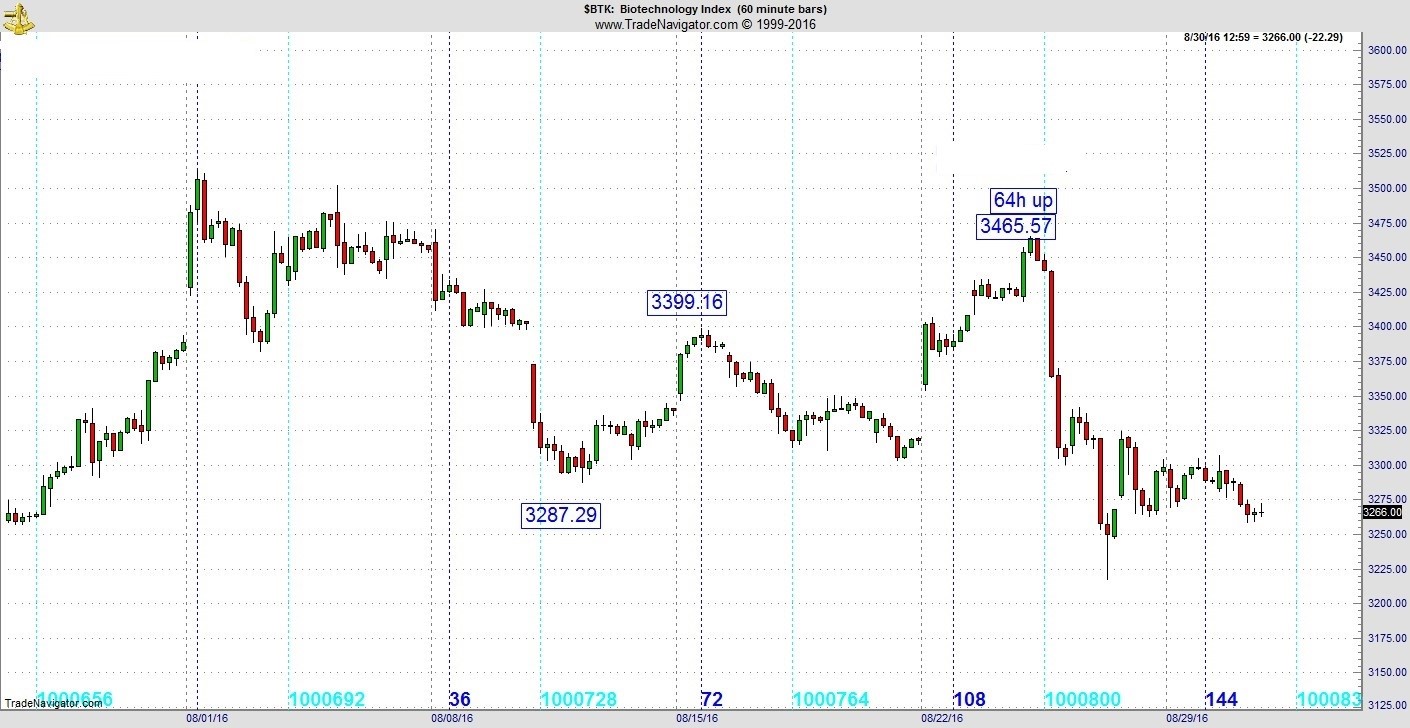
What exactly was working against the trader? In many cases, a margin of error of (+/-1) is good, but two works as well. In this case the 64/65 vibration reversed the pattern. At 64 hours up; the pattern turned at 3465.57. Price and time does square out. Consider that the trader does not know this information. They’ll never understand precisely what came against them. What are the odds the gold or BTK example would line up on the right vibration? Gann proved there is no such thing as a coincidence when it comes to financial markets.
If a trader does go long and a reversal does materialize with a vibration like this, the trader can abort before losses mount and before that gap up fills. In other words, the trader deliberately changes strategy based on new information. Understanding the vibrational work will help the trader go on offense at an opportune time, but also get defensive at the earliest possible time to minimize losses.
The Kairos Moment
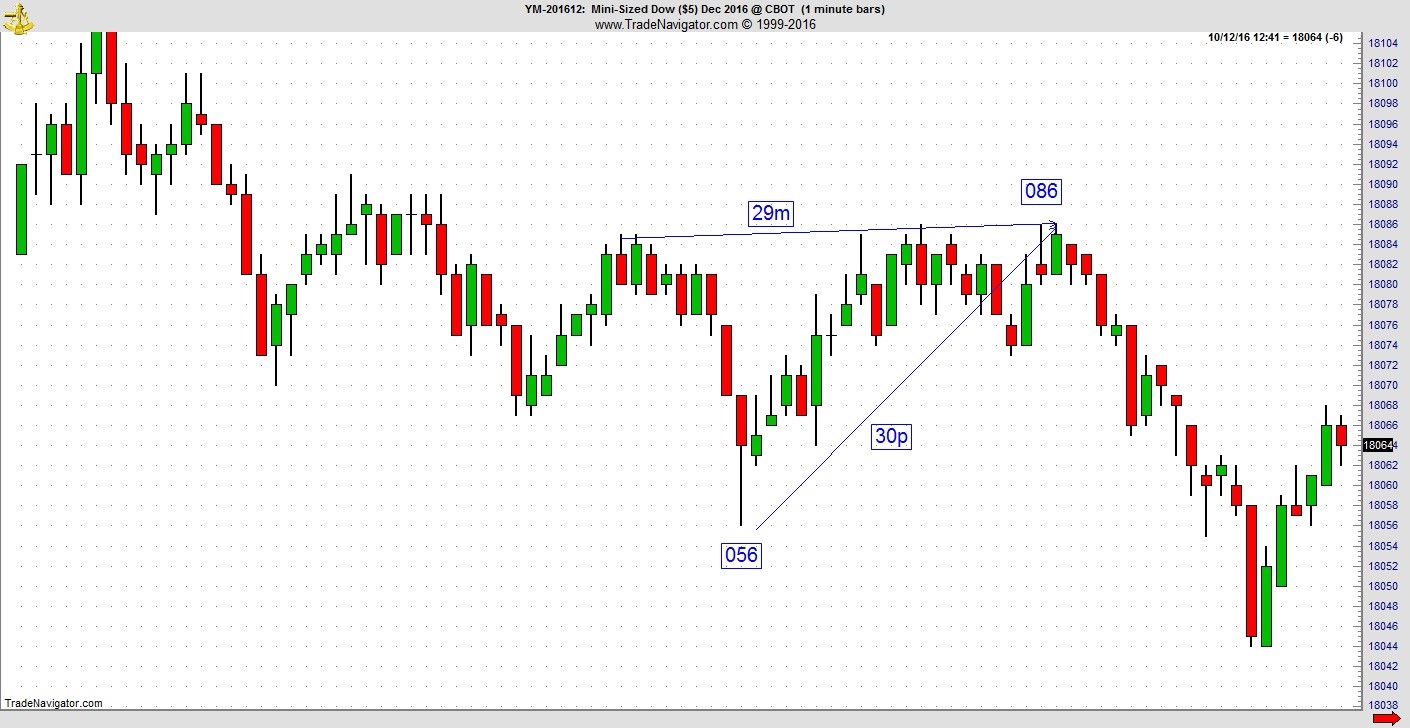
This key point in time can also be called the Kairos Moment. Kairos is a Greek word meaning the supreme or opportune moment. All financial markets have Kairos moments. Here’s another 2016 example in the mini-Dow E-mini (see chart below). From one high to the next, the time duration is 29 minutes. From the low to the high the pattern goes from 18,056 to 18,086. Price and time square out at a 29/30 vibration. Under standard assumptions with Gann aficionados, they might take that 056 low and wait some combination of 56 points or 56 minutes. But 56 is only a piece of the puzzle. The market vibrates at 30, which is where it turns. It drops nearly 40 points in approximately 13 minutes.
All of this looks really good. Is there a flaw to the methodology? In many cases, this method produces trading legs but not really big moves. On an hourly or daily chart, this means a move from support to resistance but usually not something that will last weeks or months. To catch the bigger moves, this methodology must be combined with the strategic goal of catching the vibration at a key retest of support or resistance.
This method is for traders content to take a few ticks from the market. Sometimes, a vibration will be short in duration and the trader will get stopped out. When that happens, the pattern usually will vibrate or square out at a higher level. Nothing works all the time.
Fundamental analysts will have a hard time accepting this is what is driving financial markets. Many have been taught to believe news events or earnings/fundamental reports drive the action. But cycle analysts realized long ago that when the time window matures, the news event materializes almost by magic. The vibrational methodology can work the same way. Through a process of neuroplasticity, it is highly advisable the trader go through a process of learning how to recognize opportunity before trading with real money. Neuroplasticity is the technical term where the brain grows neuropaths when we learn a new habit. According to neuroscience experts, it takes approximately three weeks to learn a new habit.
Learning the vibrational square out method works the same way. There are different variations to the tendencies involved with this method. Study a lot of charts and uncover the tendencies. Once that is accomplished, learn to recognize and trust it in real time. The tendencies are like snowflakes. While no two patterns are ever the same, similar tendencies do repeat. The best traders know that when learning a new method, it will take time and a period of practice is required. It will take time for the neuropaths in the brain develop to the point opportunities can be recognized in real time. The smaller the time frame, the faster the chart.


