
There may be greater volatility ahead for the S&P 500 according to John Rawlins’ QuantCycles Oscillator
A large number of fundamental and technical inputs have put the future of the current equity market rebound in question. Data suggesting weaker economic conditions in the Eurozone, China and United States has many analysts questioning the direction of markets and the future of the current secular bull market.
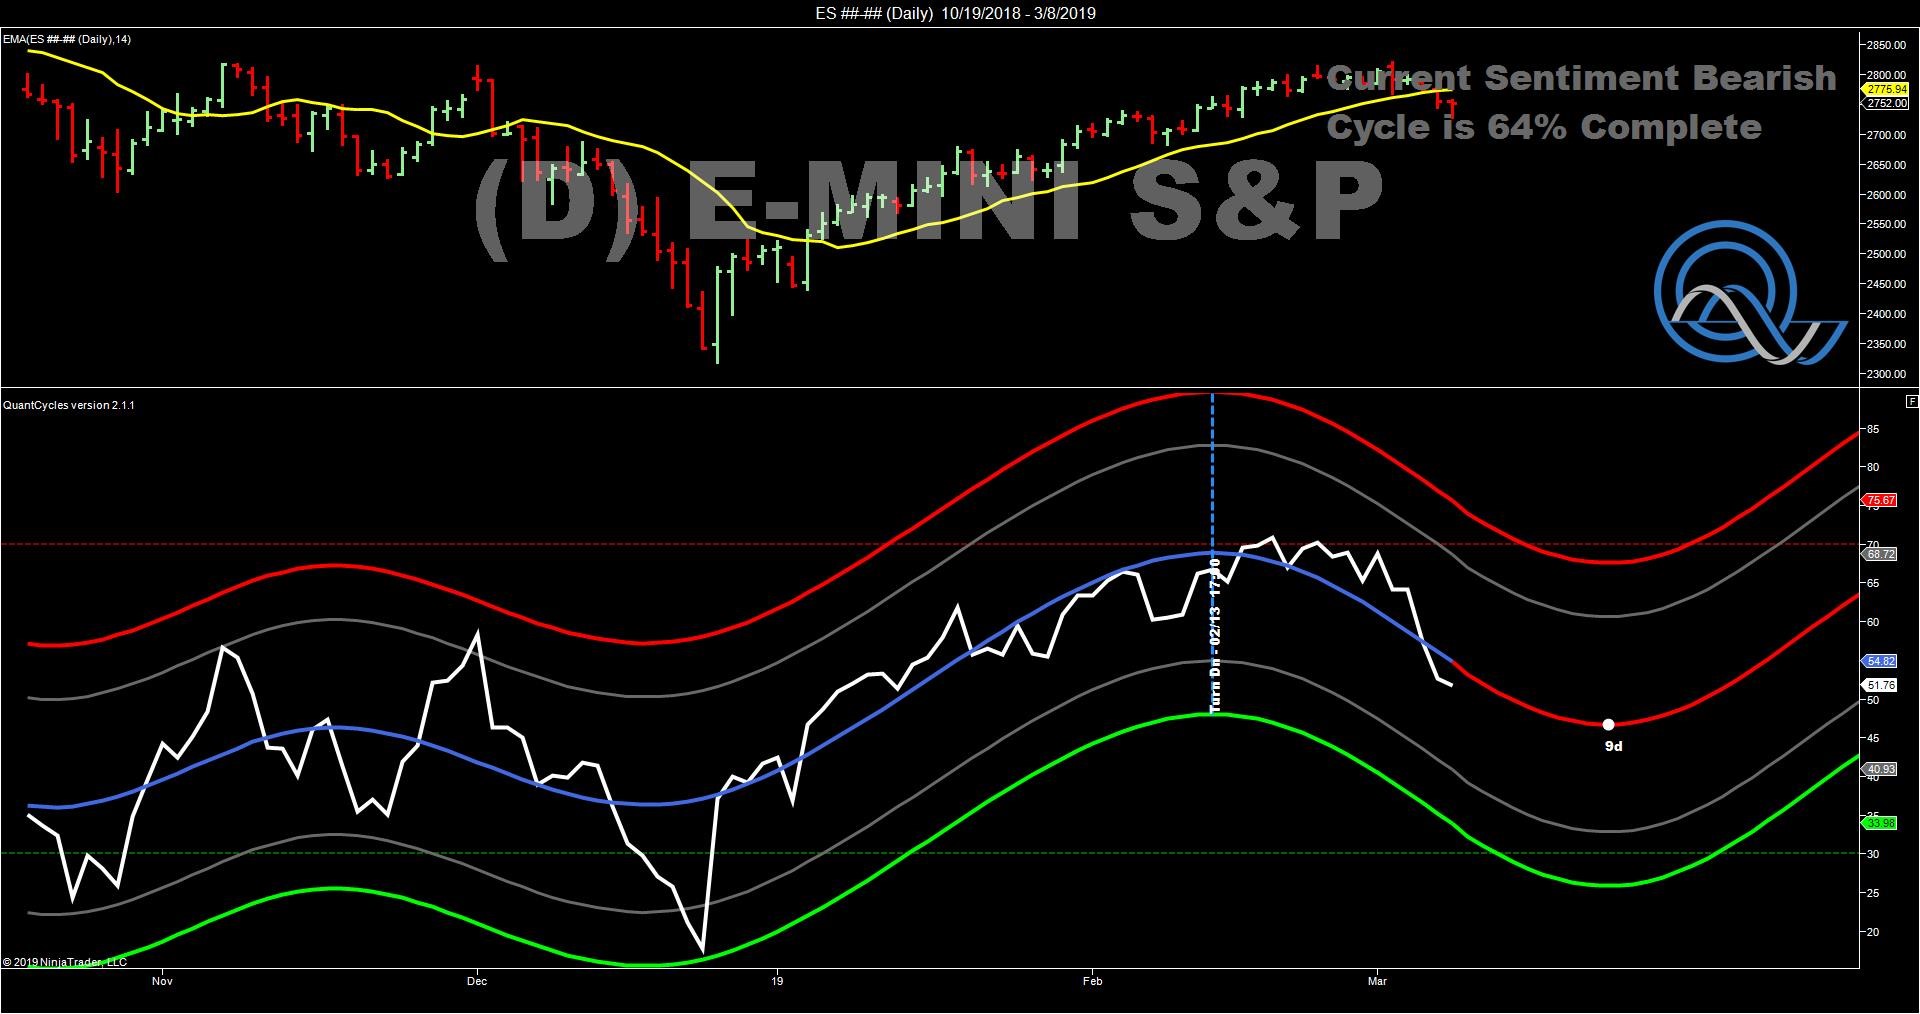
The broad equity market based on the S&P 500 has failed to confirm it has returned to the long-term bull trend as the rally from the Q4 sell-off has stalled at important technical levels.
This uncertainty was confirmed by last week’s weakness as the S&P failed to take out key resistance levels.
The QuantCycle Oscillator is showing conflicting signal, but broadly more volatility ahead. The daily QuantCycle has the S&P continuing to move lower over the next two weeks.
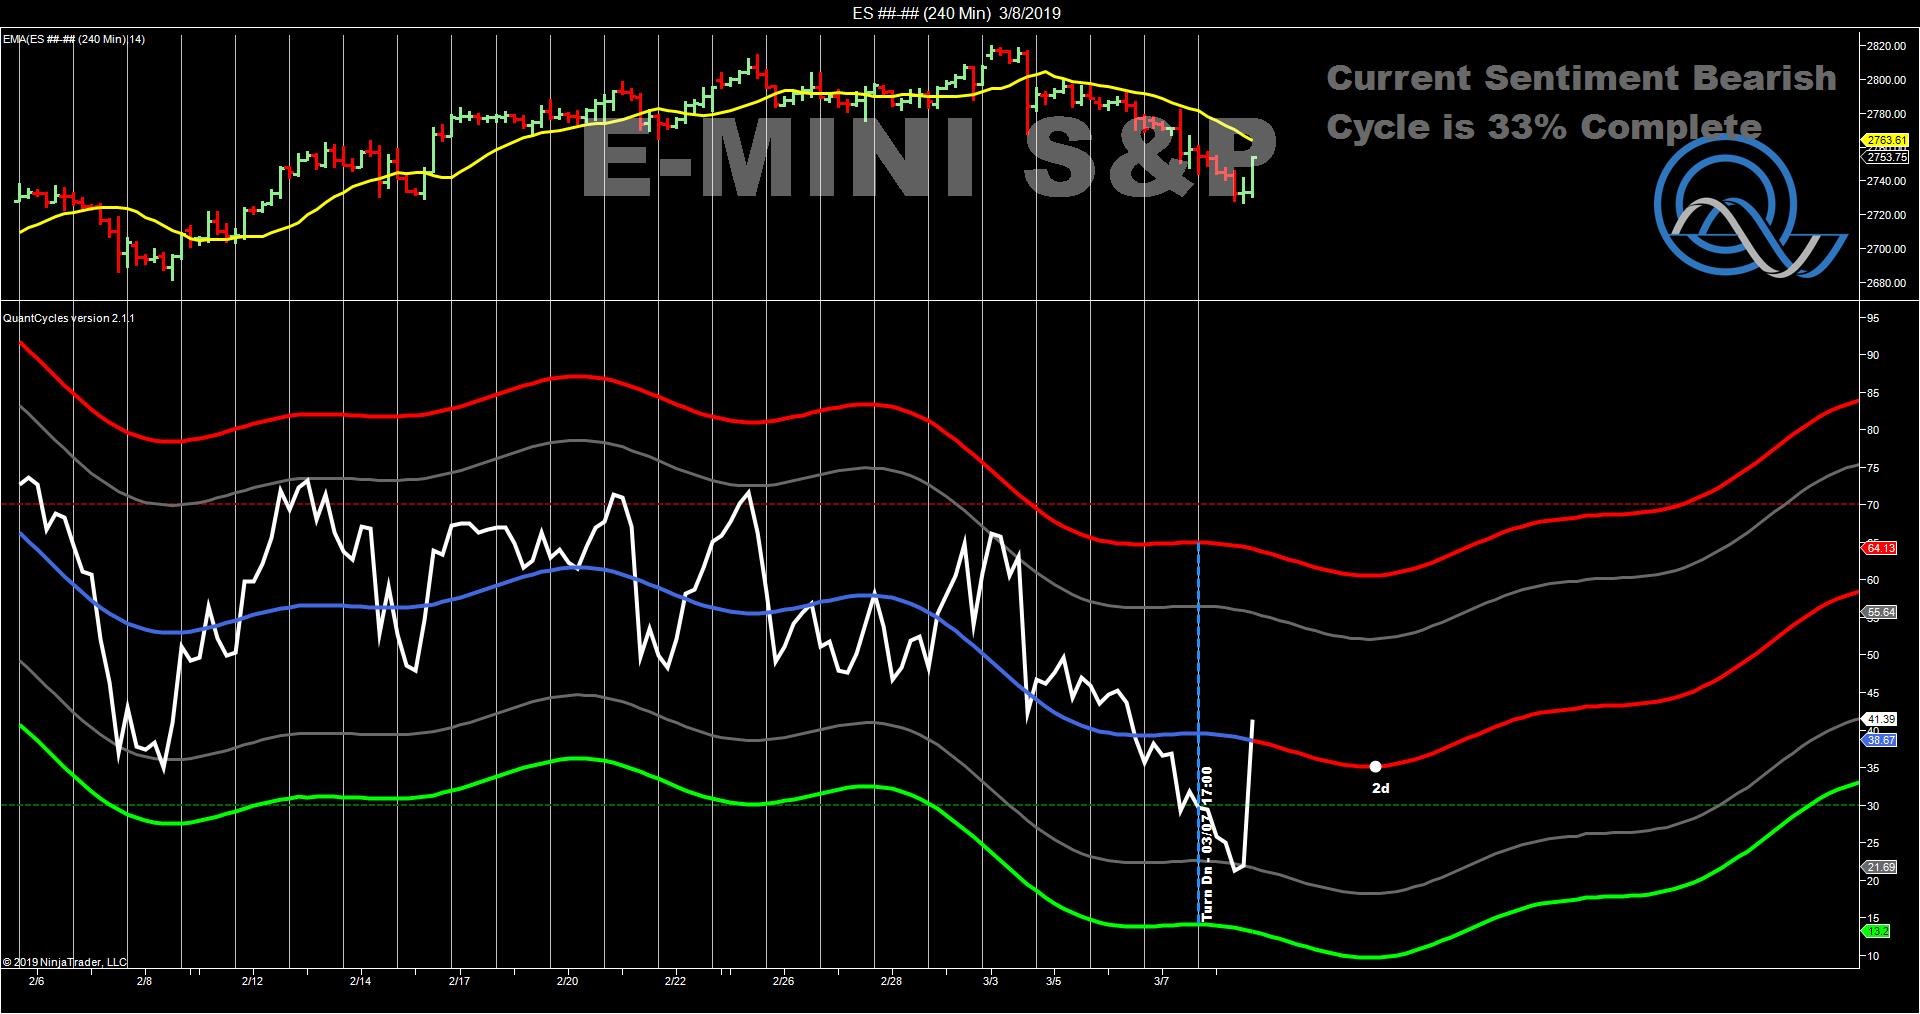
However, when we drill down to the 240-mintue chart, there appears to be some conflict. The S&P 500 rallied off of its Friday lows at the end of the session, suggesting end-of-day strength could continue into this week (see chart).
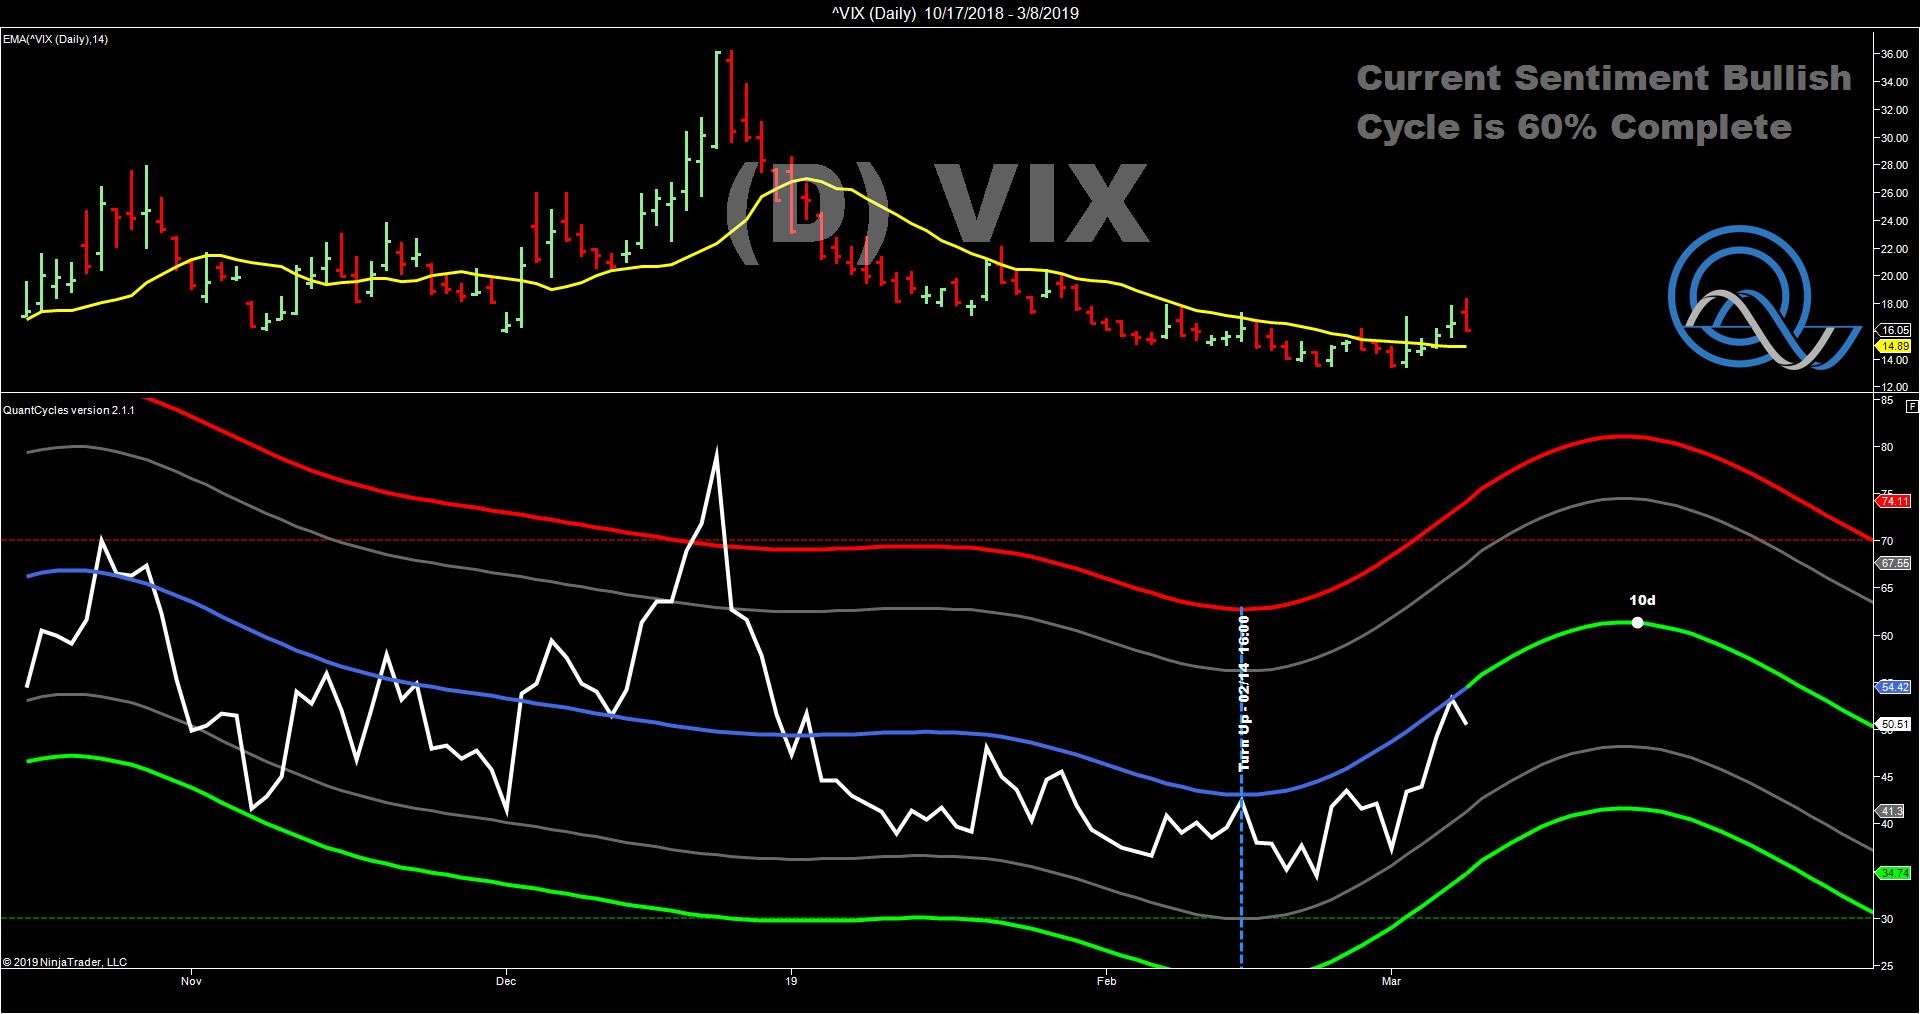
Using the Cboe Volatility Index (VIX) as the tiebreaker, it is clear that more volatile days are ahead. The VIX suggests that the weakness may continue for the next two weeks. What is clear is there may be greater two-way volatility coming. Given the Administration’s ability to float rumors regarding the prospect of U.S.-China trade deals, and the market’s tendency to buy into those rumors it would be best to take profits when you can on short plays and use upward breakouts to get short, then wait for a clearer picture to take a longer-term approach.
John Rawlins described the value of the QuantCycle Oscillator recently at the Orlando MoneyShow.
The QuantCycle indicator is a technical tool that employs proprietary statistical techniques and complex algorithms to filter multiple cycles from historical data, combines them to obtain cyclical information from price data and then gives a graphical representation of their predictive behavior (center line forecast). Other proprietary frequency techniques are then employed to obtain the cycles embedded in the prices. The upper and lower bands of the oscillator represent a two-standard deviation move from the predictive price band and are indicative of extreme overbought/oversold conditions.


