
A technical outlook of the long-term range in the EURUSD by Al Brooks.
The EURUSD daily Forex chart ended its two-month bear trend last week by breaking above the Feb. 28 major lower high. After the strong selloff on Thursday and Friday, the chart will likely go sideways for several days.
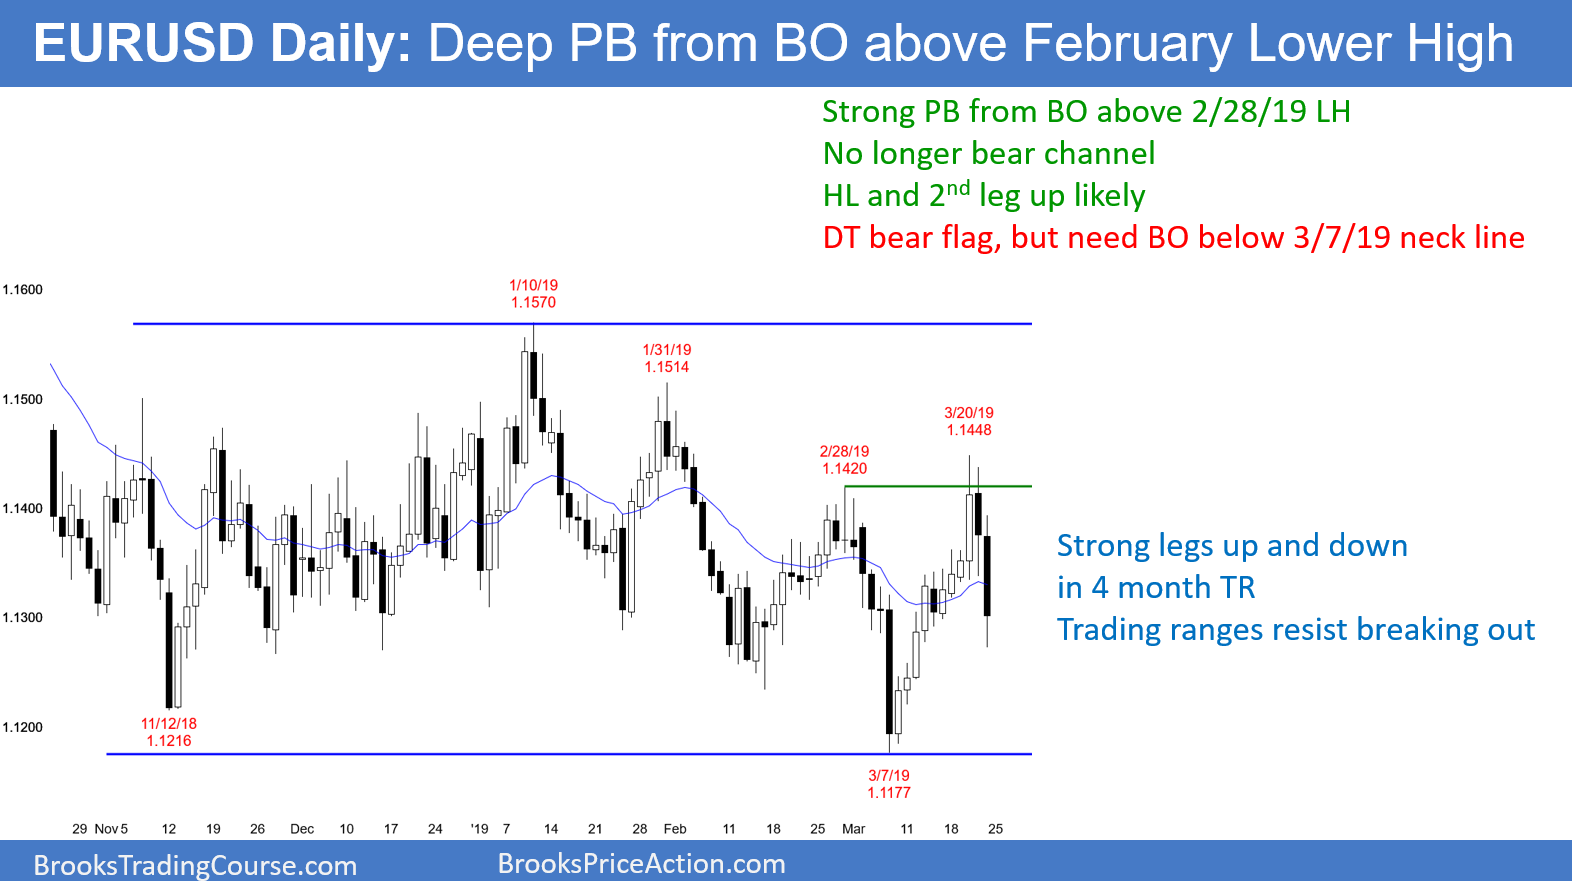
A bear trend needs lower highs and lows. Once a rally breaks above a major lower high, the bear trend has ended. The chart is then back in a trading range, and possibly a bull trend.
After big bear days on Thursday and Friday, the bulls are as disappointed as the bears were by the break above the Feb. 28 lower high. That typically results in several sideways days.
Through Wednesday, there were 10 bars with every low above the low of the prior bar. That represents eager bulls. Consequently, they will probably take this opportunity to finally buy below the low of the prior bar. Despite the strong two-day selloff, there will probably be a second leg sideways to up starting within a week.
This is especially true after the two-month wedge bottom. A strong reversal up from a wedge bottom typically has at least two legs sideways to up. Traders should expect a second leg starting this week.
Still in a trading range
There have been many strong moves up and down over the past four months. Some were very strong, and even broke beyond the trading range. This happened at the high in January and the low in March.
In every instance, I reminded traders of my 80% Rule on Inertia. Trading ranges resist breaking out. The market has a strong propensity to continue what is has been doing.
During strong rallies and selloffs, a reversal is more likely than a breakout into a trend. That is always the case until there are consecutive closes above or below the range.
Every trading range eventually breaks out. This range has lasted longer than any other over the past two years. It will probably break out up or down within a month or two. Traders are waiting for clarity on Brexit. Once there is a breakout, traders will look for a measured move up or down, based on the 400-pip height of the range.
Trading Room
Traders can see the end of the day bar-by-bar price action report by signing up for free at BrooksPriceAction.com. I talk about the detailed E-mini price action real-time throughout the day in the BrooksPriceAction.com trading room. We offer a to-day free trial.


