
The QuantCycles Oscillator shows a strong buy signal in soybeans, says John Rawlins.
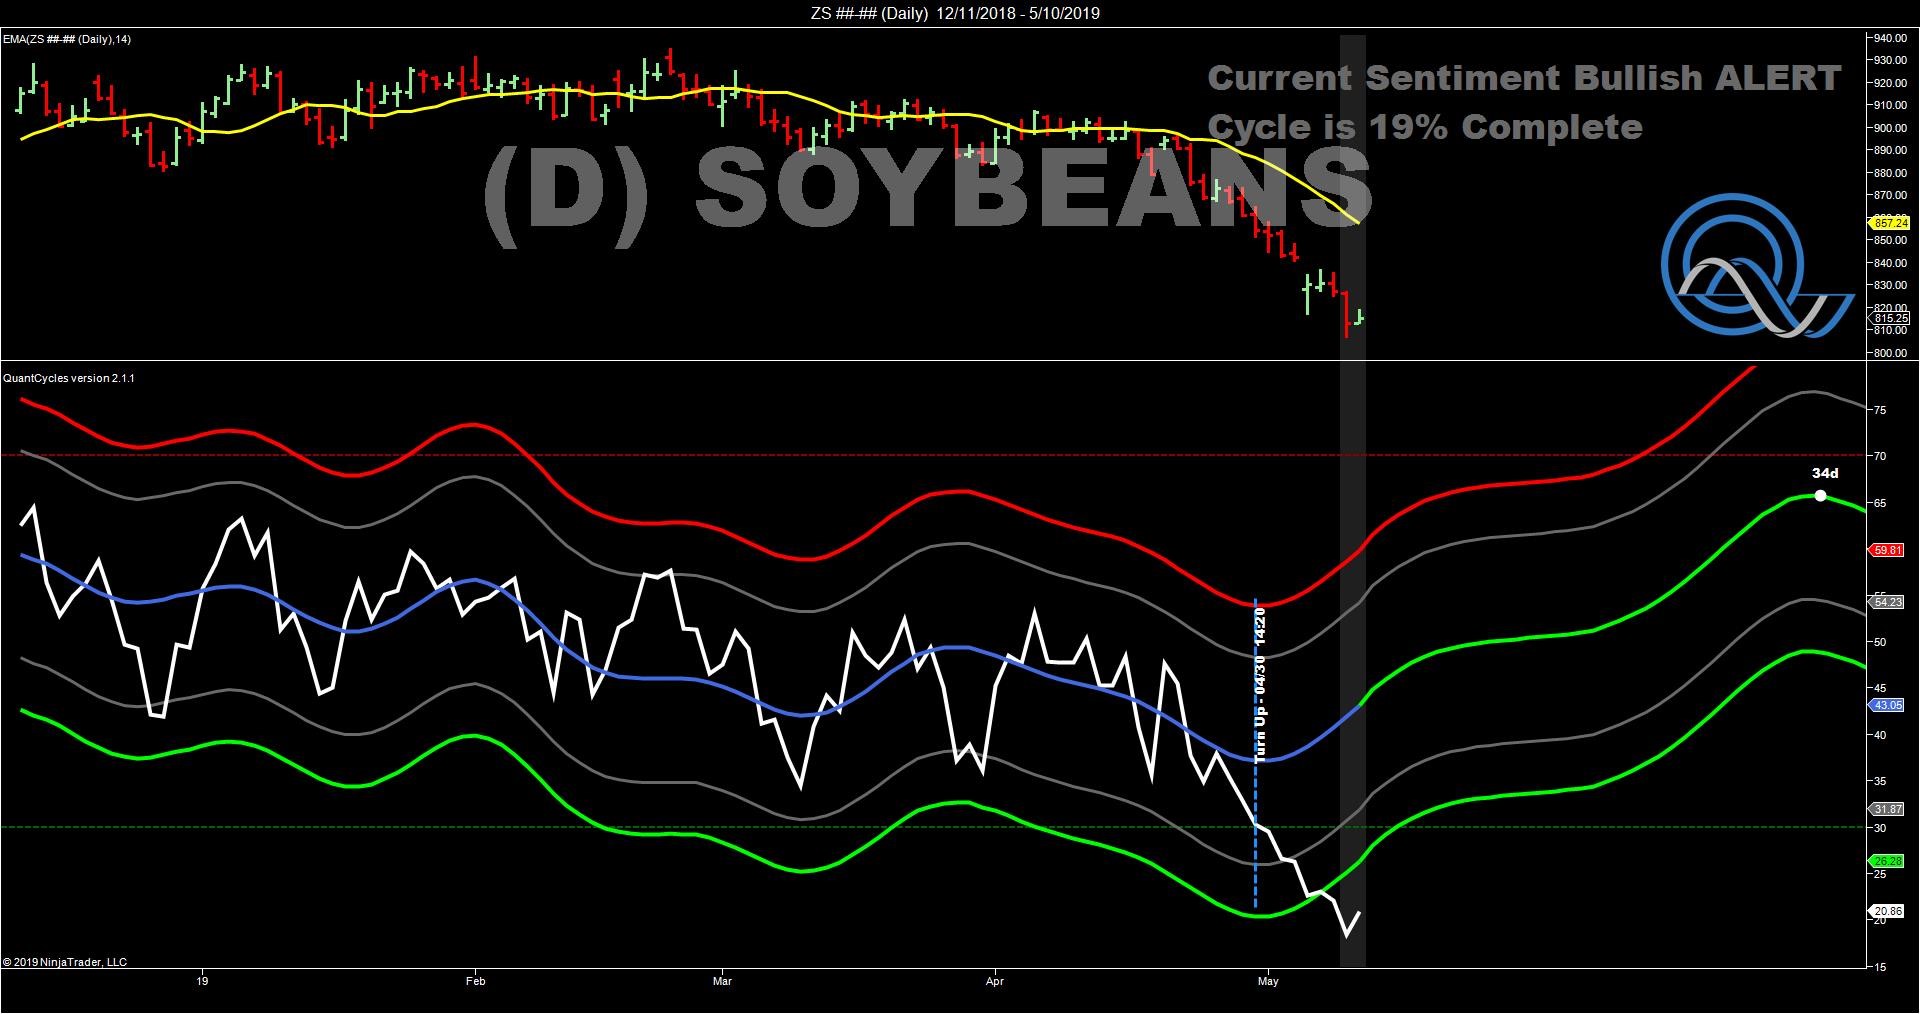
The QuantCycles Oscillator anticipated soybeans would make a bottom and turn higher around May 1. It didn’t and the persistent weakness has pushed soybeans into major oversold territory.
As you can see on the chart below, the oscillator is extremely bullish as soybeans are extremely oversold. This is a strong buy signal.
Perhaps the weakness has to do with an extreme wet spring making it difficult to get crops in the ground forcing some farmers to switch from corn to soybeans, but that on go so far and continued wet conditions—as we have had in the Midwest— can also push beans higher. Continued trade tensions with China may also have impacted on ag prices, but the bearish news is mostly priced in.
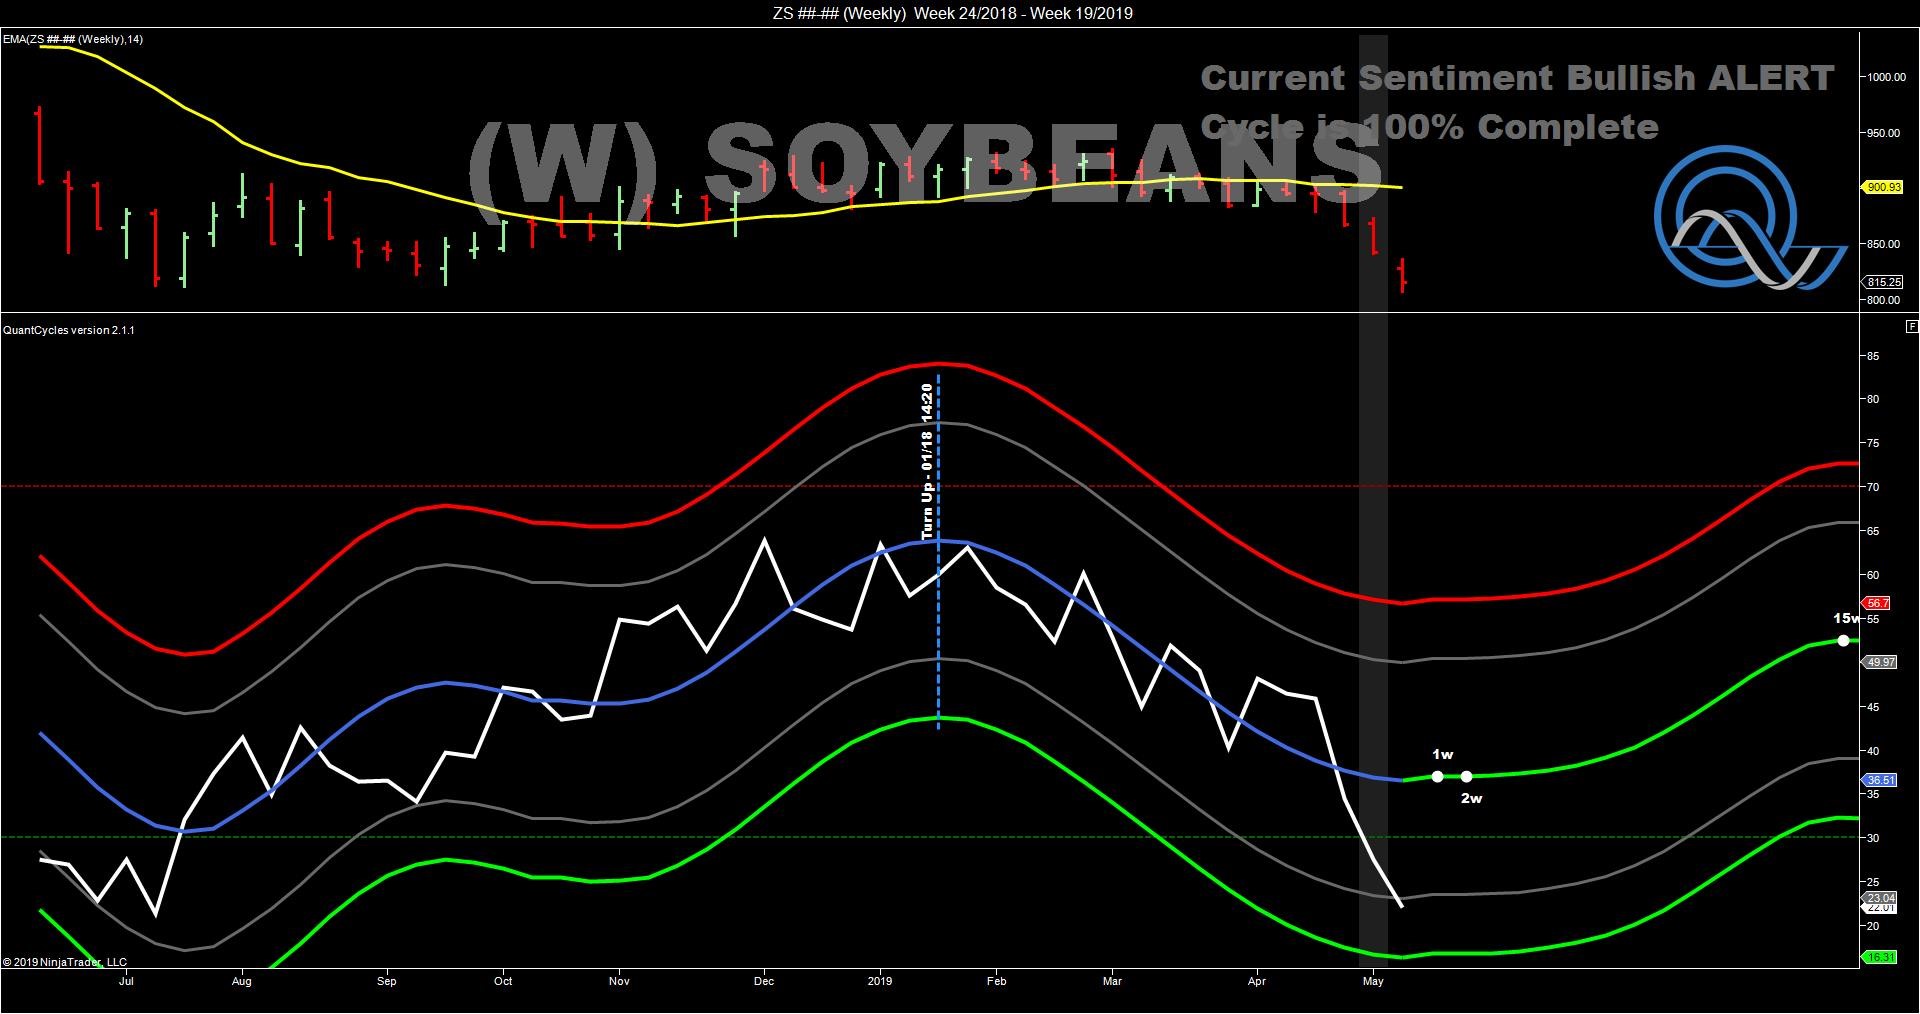
Our long-term (weekly) oscillator has bottomed out and is turning upward as soybeans near extreme oversold territory (see chart).
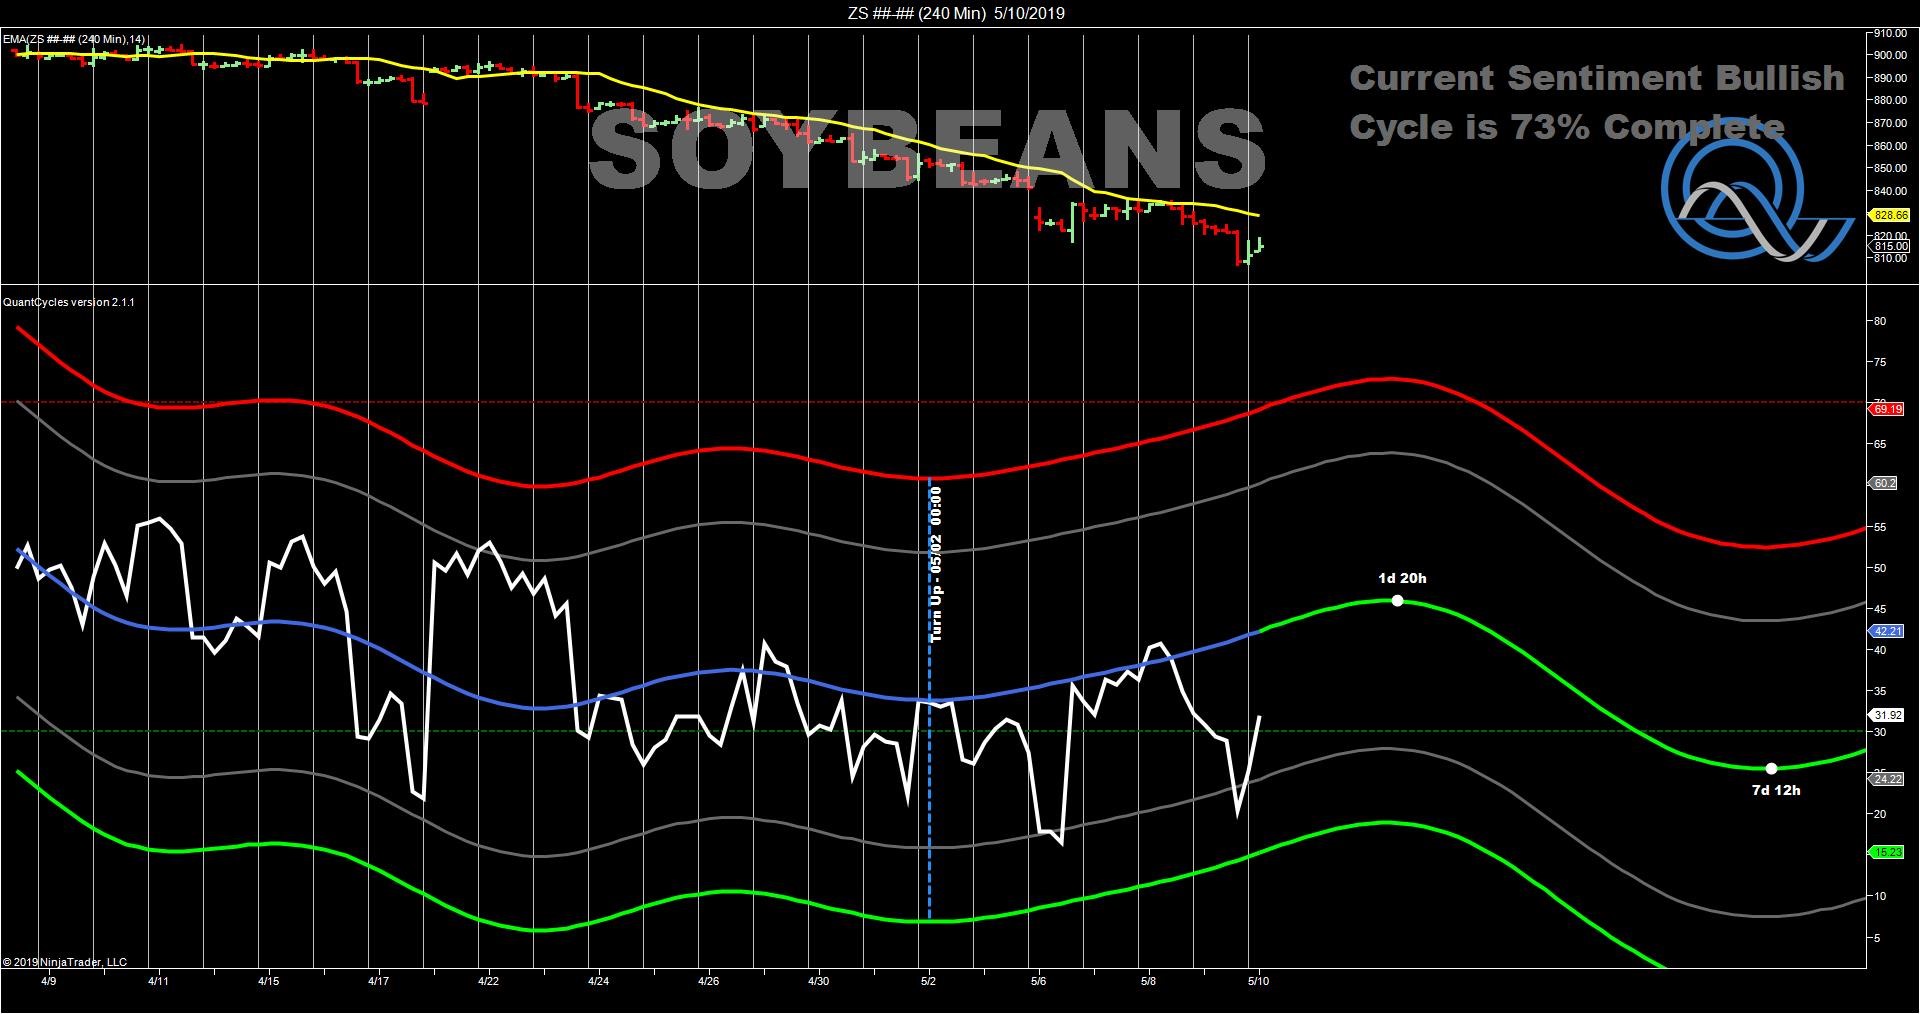
Looking at our four-hour chart indicates that a bottom may already have been made on Thursday and it is time to buy. While there may be some additional volatility next week this appears to be a strong long-term play, especially if a trade deal is announced tomorrow.
Normally, we would not suggest taking a position going into a big number, but given the recent weakness is soybeans, we think most of the risk is to the upside.
Good Call!
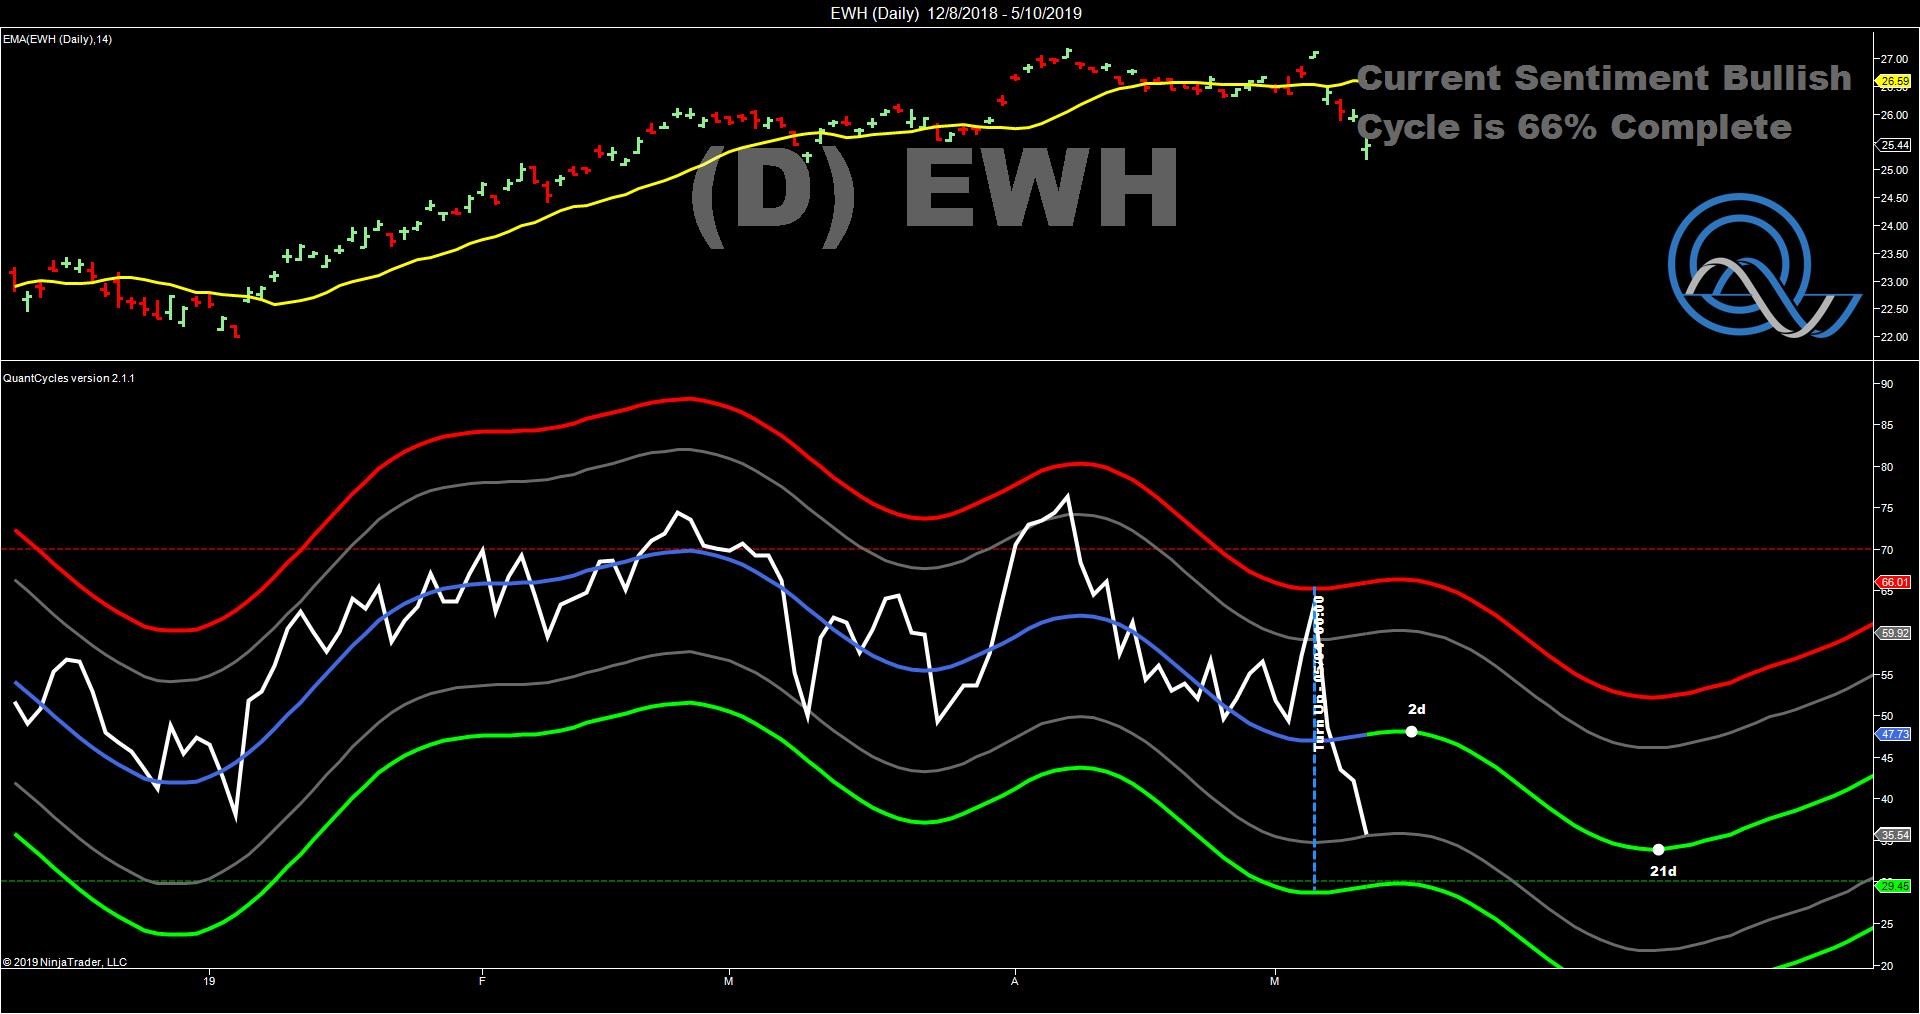
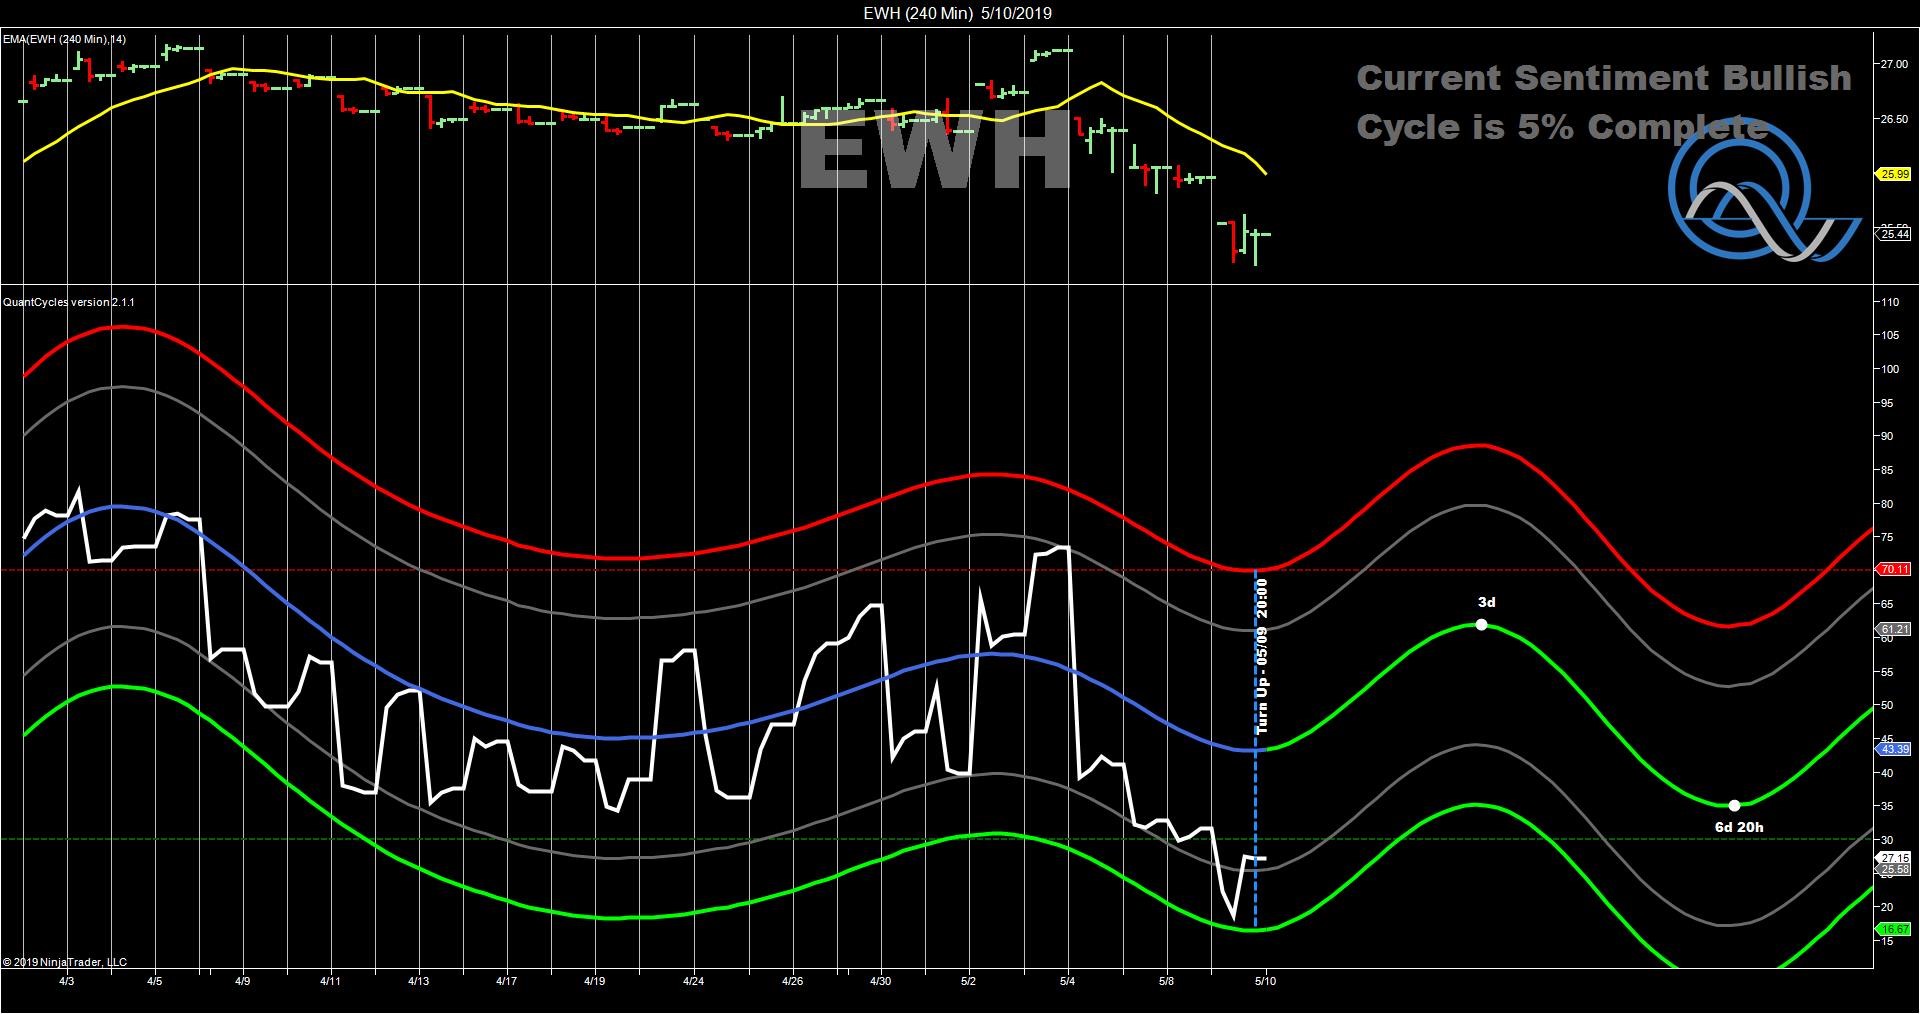
On Monday we wrote that the QuantCycles Oscillator had indicated a short in the iShares MSCI Hong Kong Index Fund (EWH). It was a fortuitous call because the fundamentals of increased trade tensions with China was also working in our favor.
EWH decline more than 5% from Friday’s close. While the daily oscillator indicates continued weakness (see first chart), short-term players may consider taking profits especially with a potential trade announcement with China coming out tomorrow (see second chart).
There is definitely the possibility for continued profit in this short, but it could get a bit volatile.
John Rawlins described the value of the QuantCycles Oscillator recently at The Orlando MoneyShow.
The QuantCycles indicator is a technical tool that employs proprietary statistical techniques and complex algorithms to filter multiple cycles from historical data, combines them to obtain cyclical information from price data and then gives a graphical representation of their predictive behavior (center line forecast). Other proprietary frequency techniques are then employed to obtain the cycles embedded in the prices. The upper and lower bands of the oscillator represent a two-standard deviation move from the predictive price band and are indicative of extreme overbought/oversold conditions.


