
The QuantCycles Oscillator is indicating weakness in the iShares MSCI Hong Kong Index Fund (EWH), says John Rawlins.
With the markets being roiled by President Trump’s tweet regarding tariffs on China it is a good time to look at related markets.
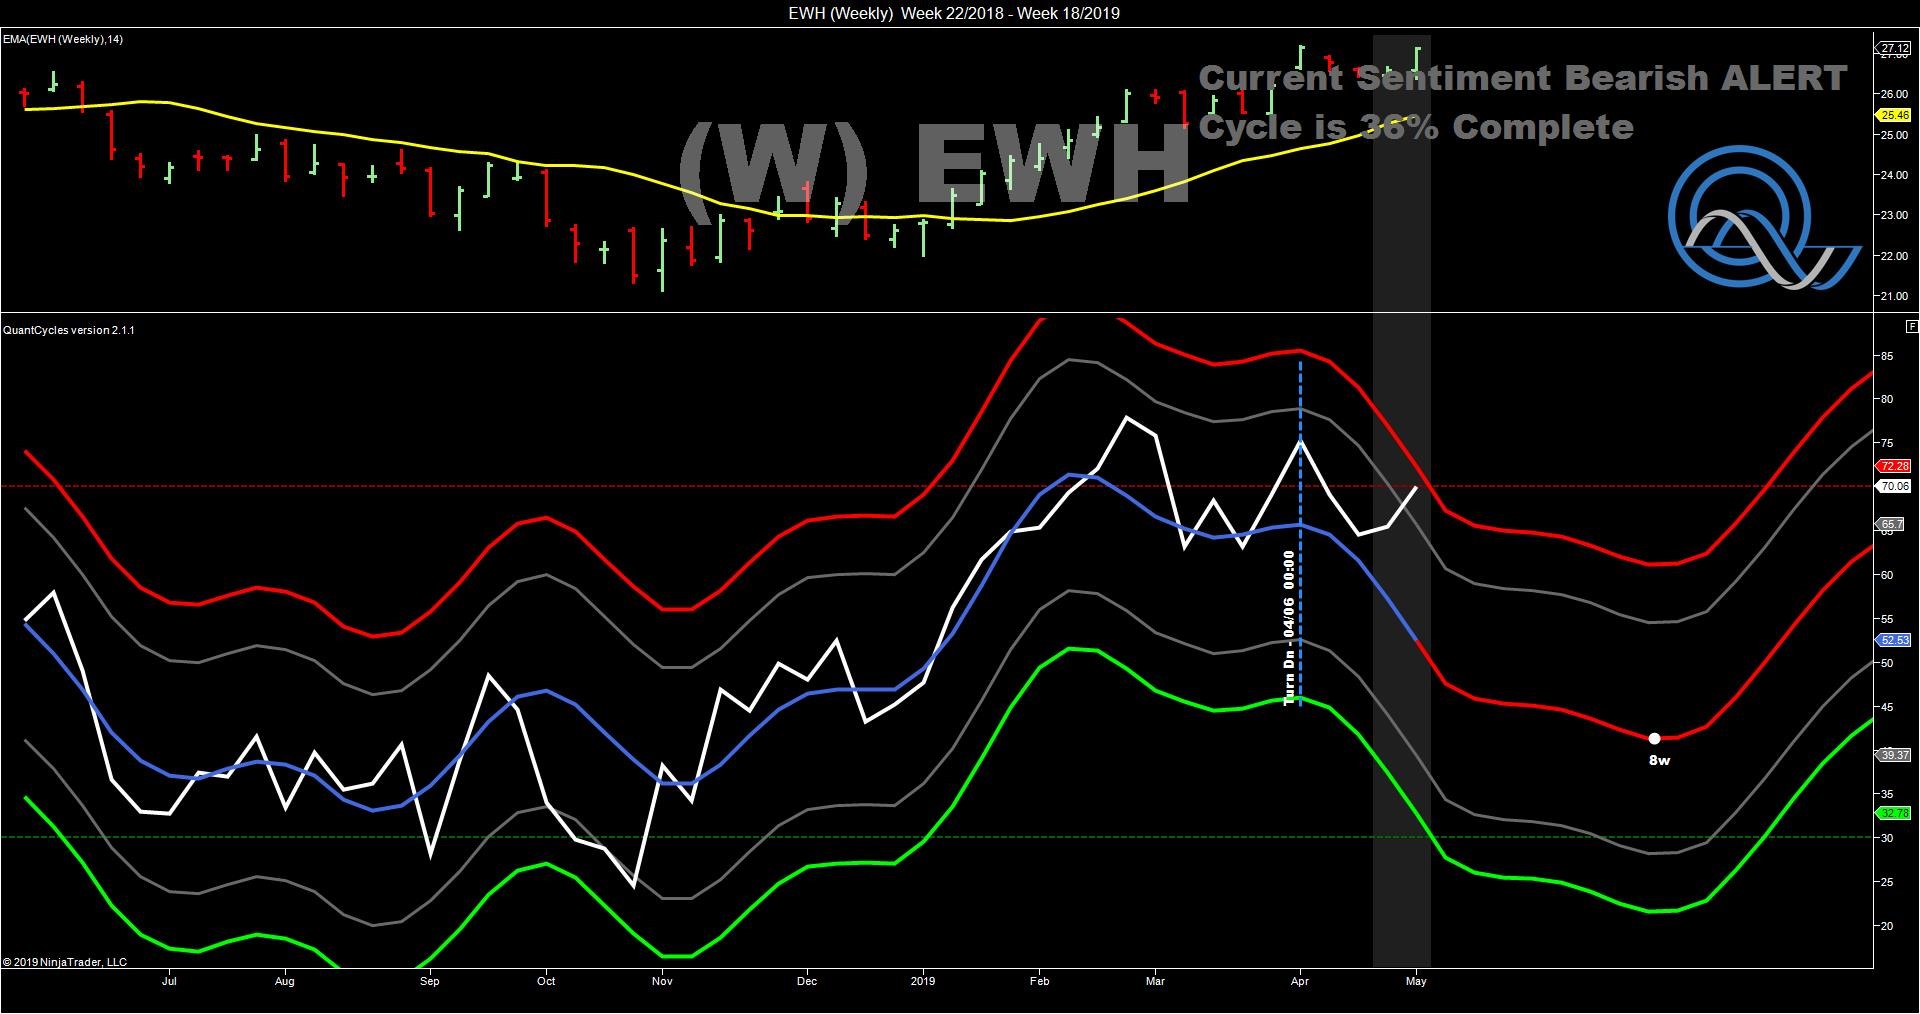
On Friday the QuantCycles Oscillator indicated a sell signal for the iShares MSCI Hong Kong Index Fund (EWH).
The weekly chart turned lower at the beginning of April. After selling off the first couple of weeks of the month, EWH rallied putting the oscillator near extreme overbought territory just as it indicates further weakness (see chart).
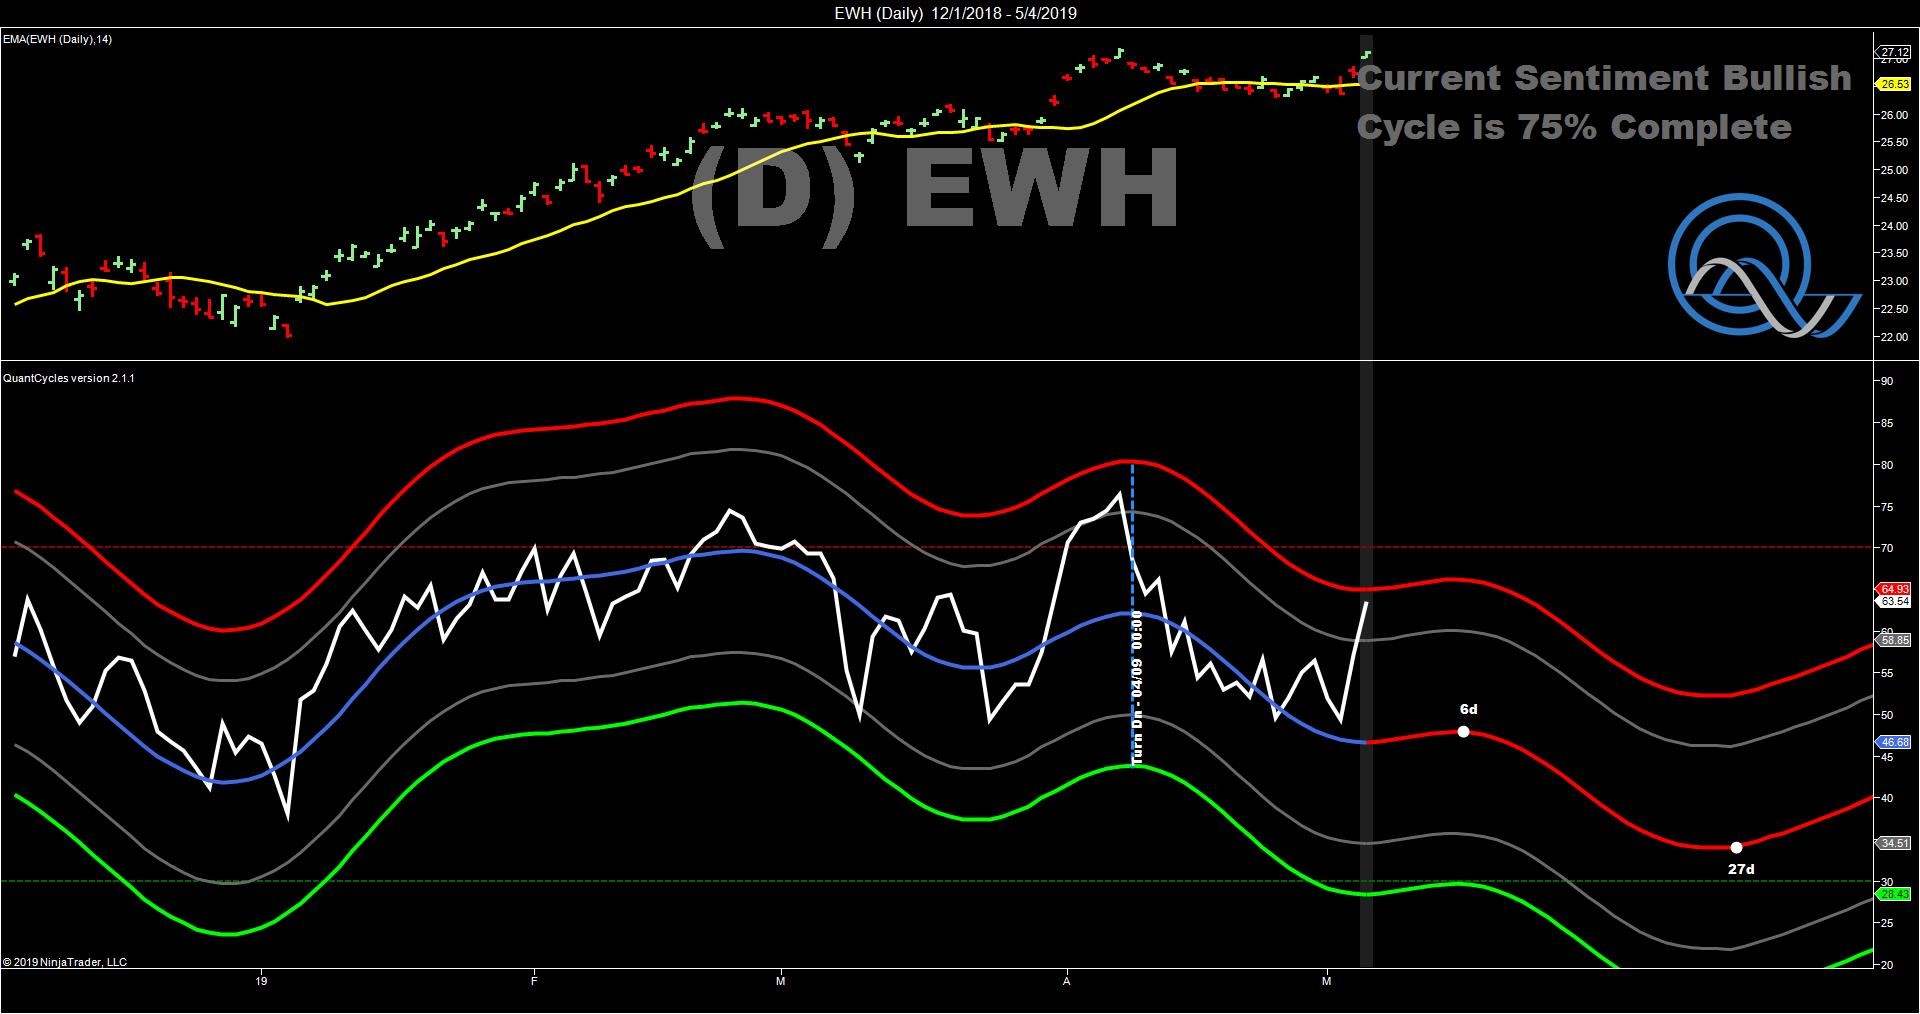
The daily chart of EWH is also near extreme overbought territory confirming the sell signal (see chart). If you missed the Friday move, the daily chart suggest that there may be a better entry in a week or so, but if you are a longer-term trader you may not want to wait to get short.
John Rawlins described the value of the QuantCycles Oscillator recently at The Orlando MoneyShow.
The QuantCycles indicator is a technical tool that employs proprietary statistical techniques and complex algorithms to filter multiple cycles from historical data, combines them to obtain cyclical information from price data and then gives a graphical representation of their predictive behavior (center line forecast). Other proprietary frequency techniques are then employed to obtain the cycles embedded in the prices. The upper and lower bands of the oscillator represent a two-standard deviation move from the predictive price band and are indicative of extreme overbought/oversold conditions.


