The current symmetric triangle pattern in gold provides a great opportunity for technical traders, regardless of whether they’re bullish or bearish gold, writes Suri Duddella.
CME Group Gold Futures is the benchmark futures contract for gold prices. Gold futures are hedging tools for commercial producers and gold users. Gold is widely viewed as a safe-haven asset in times of uncertainty and primarily used for portfolio diversification or as a hedge against inflation. Gold futures are an alternative to investing in gold bullion/coins or gold mining stocks. Gold futures do offer great liquidity/options trading and are very responsive to world events/market conditions.
Gold prices have been trading side-ways since 2016 between $1,150 and $1,450. Gold is up 2.2% in 2019 compared to its 4.4% loss in 2018. Gold prices have surged more than 4.5% from the May lows.
Symmetric triangles can be characterized as areas of indecision. Market price-action pauses during these indecision periods as the forces of supply and demand nearly become equal. Volume tends to be diminished during these consolidation phases. Eventually, a resolution (breakout or breakdown) from the upper or lower trend lines will result and prices will explode out the Symmetric triangle.
Usually, Symmetric triangles break in the direction of its prior trend, signifying a continuation pattern status. Please note that there are many cases where symmetric triangles result in a reversal pattern also after its initial breakout in the opposite direction, giving the trader the opportunity to trade the failure side of the pattern.
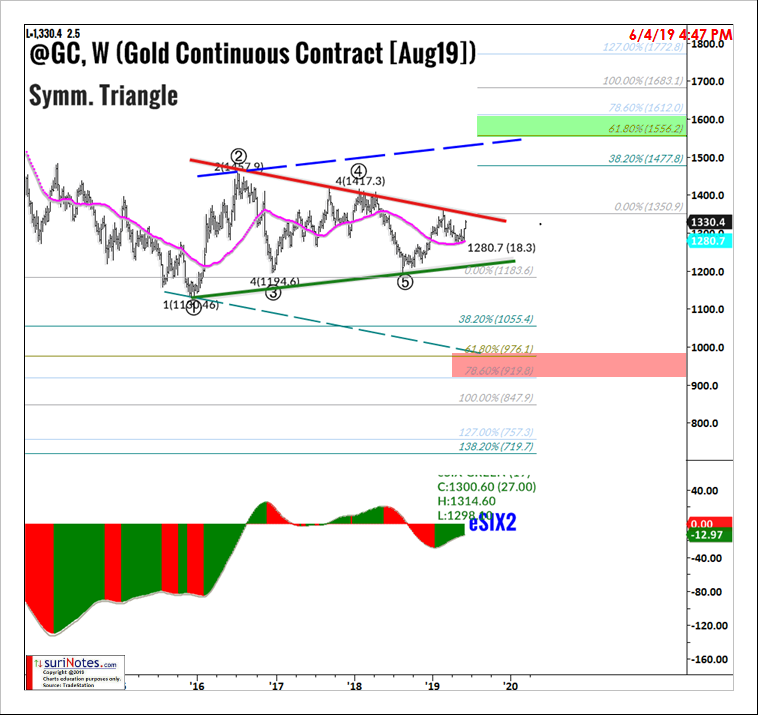
Gold Futures are forming a symmetric triangle dating back to 2016. The upper trend line (resistance line) is connecting the high of 2016 ($1,467) and the high of 2018 ($1,417). The current price of $1,330 is trading above 200-day simple moving average ($1,280). A decisive breakout with increased volume above $1,350 will confirm a symmetric triangle breakout.
A parallel line to the lower-trend line is drawn through the pivot (2 on chart below) as the Symmetric triangle target level. This target level $1,550 also coincides with the symmetric triangles first target range $1,550 to $1,612 for a breakout. Consequently, if price closes below the lower trendline and below pivot (5) at $1,183, it may signify as breakdown.
A parallel line to the upper trend line is drawn through pivot (1) as the symmetric triangle breakdown target. This target level of $976 also coincides with the symmetric triangle’s first target range ($917 to $916) for breakdown.
A smart trader does not have to speculate on the direction of the next move. As the triangle narrows, it makes a breakout or breakdown more likely, and less risky. The trader can enter on a stop once the support or resistance level is breached. The protective stop goes at the opposite breakout/breakdown level, which narrows as the symmetric triangle persists.