
The E-mini S&P 500 future rallied strongly last week and formed an outside up weekly bar, signaling a buy signal bar for this week.
The monthly E-mini S&P 500 chart has a big bull bar so far in June. We have stressed over the last month that the selloff would probably only last two to three months. Traders are debating whether it has ended (see chart).
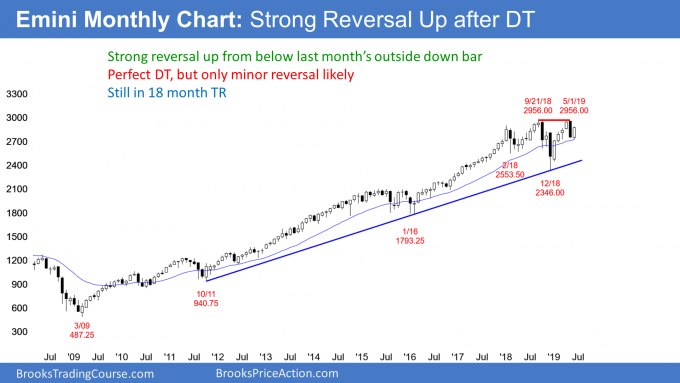
May was an outside down bar and it formed a perfect double top with the September high. When June traded below the May low, it triggered the monthly sell signal. At the end of May, I said that there could be more buyers than sellers below the May low because the four-month rally was so strong. So far, that has been the case.
Strong bull candlestick, but three weeks left in June
It is early in the month and the month could look very different when it ends. If there is a selloff, June could be a bear trend bar at the end of the month. Alternatively, it could rally above the May high and be an outside up month. Since May was an outside down month, this would create consecutive outside months. Traders in July would see June as a buy signal bar.
These are the two extremes and therefore neither is likely at the moment. More likely, June will have a bull body, but not break above the May high. Even a small bull body would reduce the chance of a big selloff in July.
Throughout the four-month rally, I said that the bulls would buy the first pullback and that the rally would have at least a small second leg sideways to up. That is still the case, even if the pullback lasts another month or two.
Weekly E-mini Analysis
The weekly E-mini S&P 500 chart traded below last week’s low and then above its high. This week is therefore an outside up bar. It is also a double bottom with the March 8 low. Last week is therefore a buy signal bar for this week (see chart).
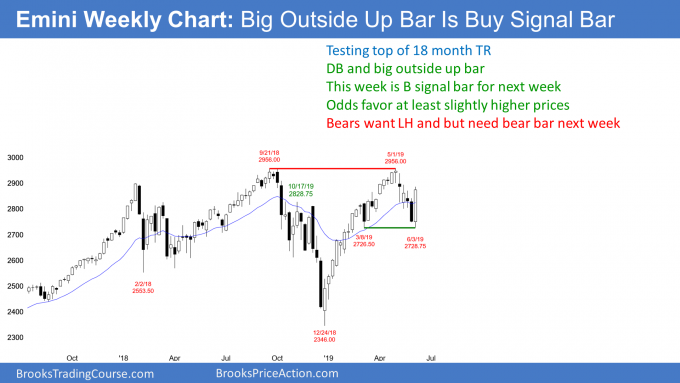
It is important to pay attention to the context. The context is the appearance of the bars to the left. The first four bars down from the high had prominent tails. A selloff that looks like that is usually going to be a bull flag or a bear leg in a trading range and not a bear trend. Those tails represent reversals. The selloff lacked sustained selling.
Has the trading range price action ended?
This past week reversed the week before. The prior four weeks all had reversals that lasted one week. This reversal up is now a two-week reversal. It is therefore similar to the four-week selloff except that the reversal was spread over two weeks.
Traders have to consider the possibility that these two weeks might be just a continuation of the price action of the four prior weeks. They will find out over the coming week. If this week is a big bull trend bar closing on its high, the E-mini would have broken the pattern of quick reversals. That would increase the odds of the rally continuing up to the all-time high.
If it is anything less, traders will wonder if the correction will continue for several more weeks. If so, the E-mini could be sideways to down before the bulls again try to test the all-time high.
Daily E-mini Analysis
The daily S&P 500 E-mini futures chart reversed up strongly this week from a test of the March 8 low and the Feb. 14 gap. The bulls hope that this double bottom will lead to a resumption of the 2019 bull trend (see chart).
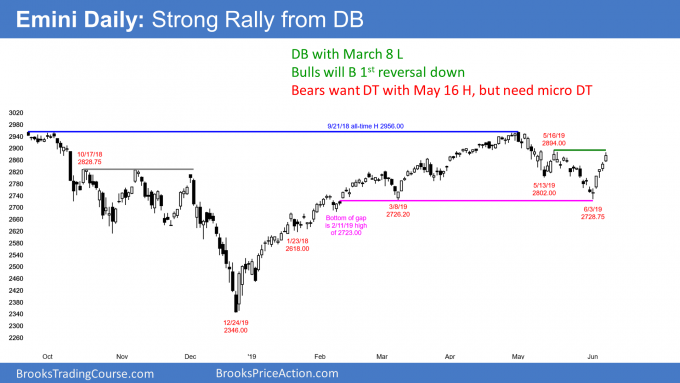
That gap was an important magnet below. The selloff not only did not close the gap, it reversed up extremely strongly from just above the gap. That reduces the chance of the gap getting filled within the next several weeks.
Traders see this strong reversal as similar to the one that began on Dec. 26. It certainly is strong enough to have at least a small second leg up. Consequently, the bulls will be eager to buy the first one- to three-day reversal down.
It is important to realize that the E-mini has been in a big trading range for 18 months and a smaller one since early February. Traders do not yet know if this reversal up is just a bull leg in the smaller trading range or a resumption of the early 2019 bull trend.
If the bull trend is resuming, the rally will have to close above the May 16 major lower high of 2894. Next, the bulls will want two closes above the September/May double top. Without this, traders have to assume that the five-month trading range is intact.
In a trading range, traders buy low, sell high, and take quick profits. They expect reversals. Trading ranges resist breaking out. Most breakout attempts fail. For example, the break below the May 13 low failed, just as the attempt to break above the September high failed. Therefore, at the moment, there is still a 50% chance that this strong rally is simply a strong bull leg in the five-month trading range.
The bears want a bigger head and shoulders top
The bears had a head and shoulders top with the March 21, May 1, and May 16 highs. I said that there was only a 40% chance of a strong selloff to around a measured move down. The selloff ended after only three days below the May 13 neckline.
If this rally turns down from below the May high, the bears will see the rally as a new right shoulder in a bigger head and shoulders top. The left shoulder would be the March 4 high. The lower high would also be a lower high major trend reversal.
Even if the bears get a good sell signal bar on a reversal down, there still will only be a 40% chance of a bear trend. This is true of all trend reversal patterns. Most do not lead to trend reversals. Instead, they usually lead to more sideways trading or a resumption of the bull trend.
When a rally is strong like this, it typically is racing up to test important resistance. The obvious target is the May 16 high of 2894 and the 2900 Big Round Number slightly above.
If the E-mini reverses down, there would be a double top bear flag. It is important to note that the second leg up in a double top is often very strong. Consequently, this week’s strong rally still could simply be the second leg up in a double top. If the bears get a strong sell signal bar next week, they will have a 40% chance of a swing down below this week’s low.
But, because of the five-month trading range, the rally will probably stall before breaking above resistance. Consequently, traders should expect a one- to two-day pullback sometime next week. Furthermore, the E-mini might begin to go sideways into the June 19 FOMC announcement.
The bulls want the rally to continue above the May 16 high without a pullback. If the rally is actually a resumption of the early 2019 bull trend, it might.
Possible bigger second leg down
The E-mini has already had two legs down from the high. However, the selloff was in a tight bear channel. When that is the case, the two legs are often just a subdivision of a larger first leg down.
This is what traders will find out over the next two weeks. If this rally turns down from a lower high, the new selloff might be the second leg down from the May high.
One reasonable target would be a Leg 1 = Leg 2 measured move. We don’t know where the top of the lower high would be. However, the second leg down would be below this week’s low. It would close the gap above the February high, and probably fall to around 2650. If so, the odds still would favor a rally to a new all-time high from there.
Trading Room
Traders can see the end of the day bar-by-bar price action report by signing up for free at BrooksPriceAction.com. I talk about the detailed E-mini price action real-time throughout the day in the BrooksPriceAction.com trading room. We offer a two-day free trial.


