
A major trading opportunity is developing in the Financial Select Sector SPDR Fund (XLF) index.
The Financial Select Sector SPDR Fund (XLF) index seeks to provide an effective representation of the financial sector of the S&P 500 Index. It seeks to provide precise exposure to companies in the diversified financial services, insurance, bank, capital markets; mortgage real estate investment trusts (REITs), consumer finance, thrifts and mortgage finance industries sectors. XLF allows investors to take strategic or tactical positions at a more targeted level than traditional style based investing. The XLF top holdings include: Berkshire Hathaway Inc. (BRK.B), JPMorgan (JPM), Bank of America (BAC), Wells Fargo & Co. (WFC), Citigroup (C), CME Group (CME), American Express (AXP) and Goldman Sachs (GS).
Financial stocks have lagged the S&P 500 Index for most of the year 2019 due to diminished earnings outlook for many financial institutions due to global trade fears and Federal Reserve policy. XLF has underperformed the SPDR S&P 500 ETF Trust (SPY) 18.9% to 20.30% and the Technology Select Sector SPDR Fund (XLK) 30.91% for the year.
The broader equity markets require the financial sector to perform well along with banks and broker/dealer sectors. Hence, it is essential to watch the relative strength of banks, Broker/Dealers and f XLF to watch the overall strength in the markets. Currently, XLF is trading in an Inverse Head and Shoulders or Head and Shoulders Bottom pattern, which is considered to be bullish with the strong underlying bullish trend.
One of the most popular chart patterns in market analysis is Head and Shoulder (H&S) pattern. The H&S patterns form near market tops in an established sideways to up-trending or bullish markets. The H&S patterns are reversal patterns as they reverse its prior uptrend and follow a bearish or downtrend from its breakdown. These patterns are signified by three successive peaks (tops) resembling two shoulders on both sides and a head in the middle. The head is the largest of the three peaks. An Inverse Head and Shoulders (Inv. H&S) pattern is the head and shoulders pattern upside down (mirror image) and follows a similar structure and trading rules (in reverse) as H&S pattern. The Inverse H&S patterns are also reversal patterns and form in established downtrends.
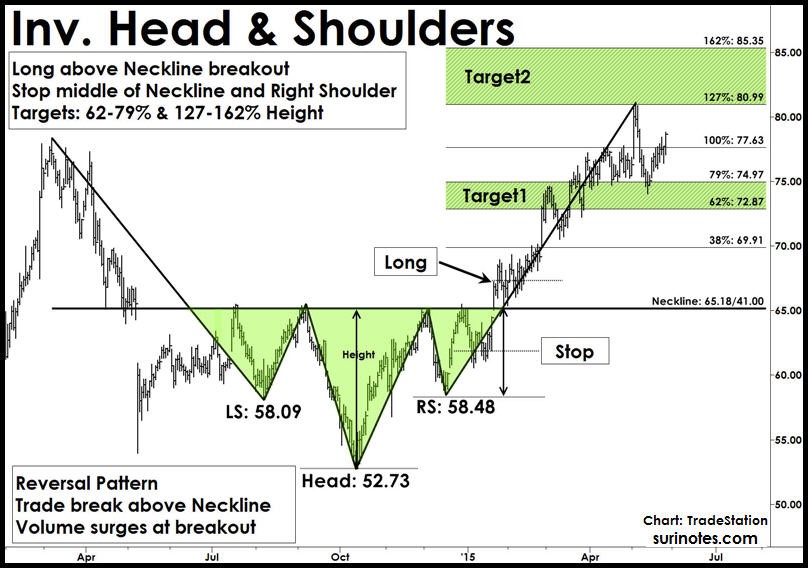
Trading Inverse Head & Shoulders Pattern
Entry: After right-shoulder formation and pattern completion — if price closes above the neckline with increased volume — enter a long trade above the breakout bar's high.
Stops: Place a partial protective stop below the middle of neckline and right-shoulder. Place a final stop below the low of the right shoulder.
Targets: Targets are projected from the neckline level. Measure the height of the head and use Fibonacci ratios to compute targets. The first target range is 62% to 79% of the height of the head, and the second target range is 12% to 162% above neckline.
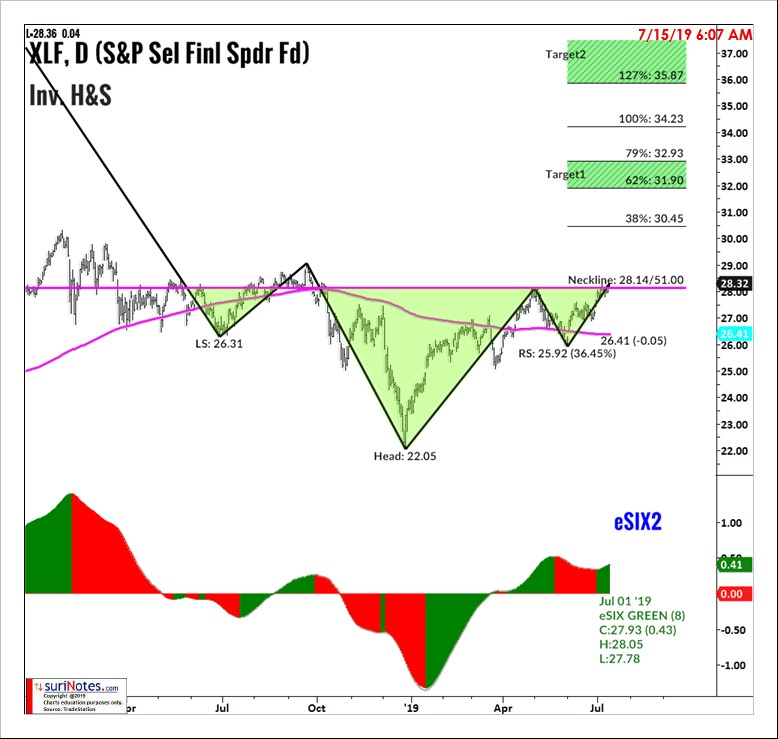
XLF Inverse Head and Shoulders Pattern
From July 2018 to July 2019, XLF has been forming Inverse Head and Shoulders pattern with the left shoulder at $26.31, right shoulder at $25.92 and head at $22.05. The neckline is at $28.14. Currently, XLF is trading above 200-simple moving average and Neckline with a strong underlying bullish trend. If prices continue to close above Neckline, it will signal an Inverse Head & Shoulders pattern breakout. The XLF upside targets are set at $30.45, $31.90 to $32.93 and $34.23.
Stops are placed below the right shoulder's low at $25.92.
Find more of Suri’s work at surinotes.com


