
The E-mini S&P 500 futures has an eight-week bull micro channel ahead of Wednesday’s FOMC meeting, writes Al Brooks.
The Emini S&P 500’s eight-week bull micro channel is a buy climax and makes a pullback likely within a couple weeks.
The monthly E-mini S&P 500 futures has three trading days left in July, which so far is a small bull trend bar (see chart). That is disappointing for the bulls, who wanted a big breakout above the September/May double top.

May traded above the April high and then below the April low. May was therefore an outside down month. June was an outside up month. When there are consecutive outside bars in a bull trend and the second one is up, those bars form an “OO” (outside-outside) bull flag.
If the next month goes above the high, it triggers a buy signal. There is then a 60% chance of at least three more sideways to up bars. Consequently, traders should expect sideways to up trading for at least into September.
That said, sideways to up, allows for a pullback. For example, bears would not need much selling for August to trade below the July low. That would be a pullback. But since the E-mini should trade sideways to up through September, traders will be more willing to buy than sell below the July low.
Weekly E-mini Analysis
The weekly E-mini S&P 500 futures had a bull bar this week. Its low was above last week’s low and its high was barely last week’s high. It is now the third consecutive sideways bar so there is now a three-bar tight trading range.
A tight trading range is a relatively neutral pattern and it is both a buy signal and a sell signal. Because this week had a bull body, it closed near its high, and it is in a strong bull trend, it is a more reliable buy signal bar. This week is more likely to go above last week’s high than below its low.
However, last week was a big bear bar and two of the prior three weeks were dojis. The bull trend is losing momentum. There will probably be sellers not far above the high.
Because the two-month rally is strong and last week had a bull body, it is a weak sell setup. Traders will buy not far below.
If this week is both a weak buy and sell setup, what will happen over the next couple of weeks? Traders should expect that if the E-mini goes up, it will soon reverse. If it goes down, it will probably reverse up. The two-month rally will likely transition into a trading range within a few weeks.
8-Week bull micro channel is a buy climax
Last week was another bar with a low above the low of the prior week. This is therefore the eighth week in a bull micro channel. That is getting extreme. Extreme means unsustainable and climactic. This increases the chance of a pullback within the next couple weeks.
A pullback simply means that the low of the week falls below the low of the prior week. An eight-week bull micro channel is climactic, but it also represents eager bulls. They have been willing to buy above the prior week’s low for two months. Many bulls will be eager to buy below the prior week’s low once they finally have the opportunity.
Consequently, the first pullback will probably last one to three weeks. This means it will be a minor reversal and not a major trend reversal into a bear trend. It will form a bull flag. Traders expect that the bull trend would then soon resume.
If there is then a new high and another reversal down, there would be a higher probability of a deeper pullback and one lasting longer. Second signals are more reliable. But since there is an upward bias on the monthly chart into September, the downside risk is still small.
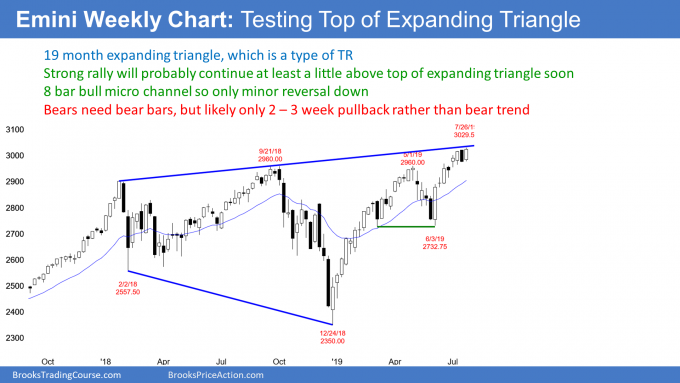
Expanding triangle top
The bulls have a problem with their strong 2019 bull trend. Look at the collapse after the sharp rally in January 2018. Next, there was a strong reversal up from the February low. There was another collapse from the new high in May 2018. It fell to below the February 2018 low. But the bulls bought it aggressively and the E-mini is now above the May/September double top.
Do you see the pattern? The E-mini is forming a series of higher highs and lower lows. This is an expanding triangle and it is present on the monthly chart as well. Each of the past four strong trends up and down reversed.
Will this time be different? Probably not. Traders should therefore expect a significant reversal down from above the May high. The rally is now at the top of the expanding triangle. That is the line drawn across the January 2018 and May 2018 highs. It currently is around 3040.
The reversal down will likely come from a failed breakout above the line at the top of the expanding triangle. In the S&P 500, traders like to talk about 1% to 2% overshoots. That means the top of the rally from December will probably be around 3050 – 3150 before there is another strong reversal down.
Can the reversal continue down to below the December low? There is currently only a 30% chance of that in 2019. The bears have a 50% chance of a retracement of about half of the rally from the December low within a year. That makes the June low around 2700 a reasonable target.
At some point, an expanding triangle evolves into some other pattern. Most often, it becomes an ordinary trading range (remember, triangles are trading ranges that either expand or, more often, contract).
The Fed will probably cut
What happens if the Fed cuts interest rates? Nobody knows. We will find out if more dollars buy or sell the news.
Since the upside over the next few weeks is small, a strong rally will soon reverse. Because the weekly chart has been in a micro channel for eight weeks, the bears will probably only get a minor reversal down.
With limited upside and downside for a few weeks, the E-mini will probably enter a trading range for several weeks. The bottom of the range might be around 2900. The top could be this week’s high or a little higher.
Daily Analysis
The daily E-mini S&P 500 futures this week traded slightly above the previous week’s high. If it reverses down this week, traders will see last week’s rally as forming a slightly higher double top with last week’s high. The neckline of the double top is last week’s low. Traders expect a break below the neckline to lead to a measured move down.

Parabolic wedge buy climax
There is another problem for the bulls. When there are three or more legs up in a tight bull channel, there is a parabolic wedge buy climax. June 11 was the first of five legs up in a tight bull channel. A buy climax at some point attracts profit takers. After five legs up, they will probably take some profits soon.
Once the bulls take profits, they will not immediately buy again. Traders typically look for at least two legs and 10 bars sideways to down. If the bears fail to get a strong reversal down by then, the bulls will again look for buy setups.
When there is a reversal down from any wedge, the first target is the bottom of the most recent leg up. That is the July 9 low of 2965.75. More often, the profit-taking gets to around the start of the wedge. Most computers see that as either the June 12 or June 26 lows, which are around 2900. Traders therefore should expect a two- to three-week selloff to around 2900 beginning within a few weeks.
Trading Room
Traders can see the end of the day bar-by-bar price action report by signing up for free at BrooksPriceAction.com. I talk about the detailed E-mini price action real-time throughout the day in the BrooksPriceAction.com trading room. We offer a two-day free trial.


