
There are numerous chart patterns ready to breakout in the homebuilders sector—which has outperformed—reports Suri Duddella.
The Homebuilders sector has outperformed the broad U.S. stock market in 2019, and analysts think the rally may continue into 2020.
A strong U.S. stock market, lower-interest rates, demographics and demand from millennials are the tailwinds for the homebuilder’s industry. As mortgage rates are pushed down, dollar strength also helped homebuilders. The inverted yield curve may curtail some housing-related stocks and gains in banks, but continued housing affordability and lower interests rates may continue to boost the housing sector in 2020.
The tables below show the top homebuilder stocks and their returns for 2019:
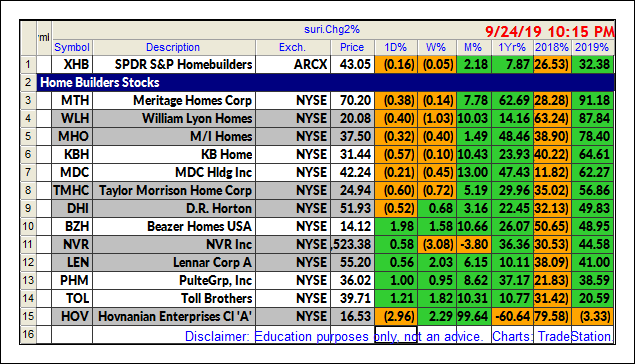
Home Builders Stocks YTD%
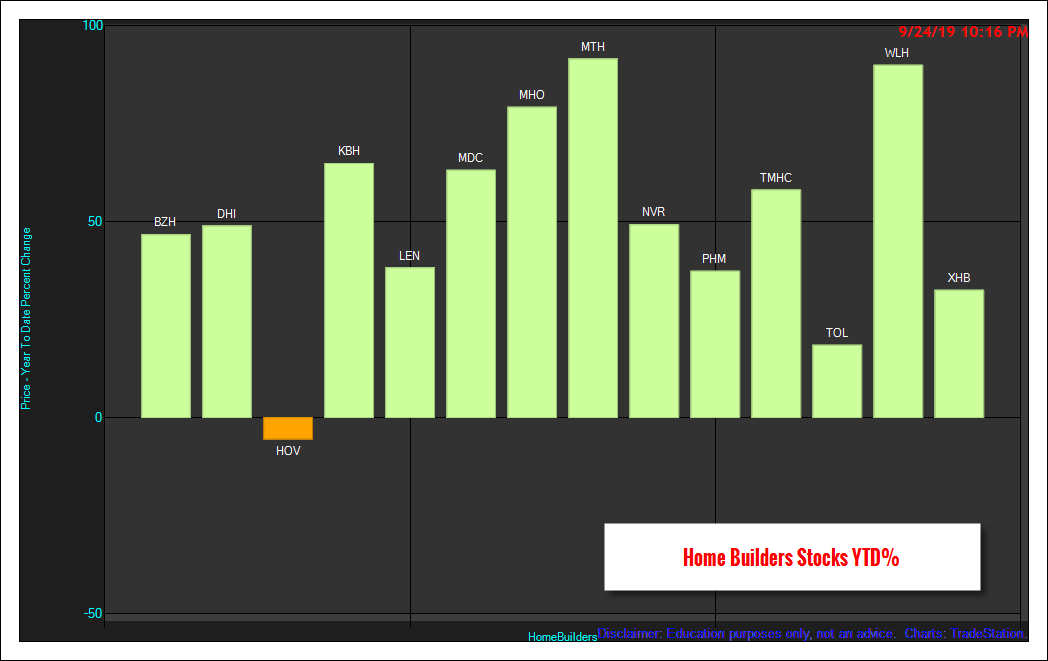
Chart Patterns in Homebuilder Stocks
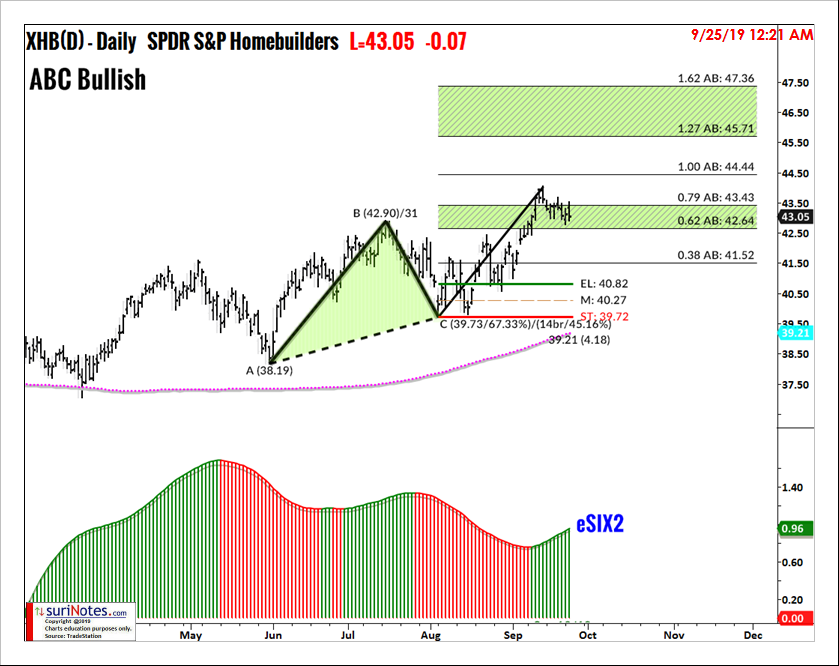
The SPDR S&P Homebuilders ETF (XHB) chart has been trading in an ABC Bullish pattern since June 2019. The long entry is above $40.82 with a stop below $39.73.
Targets are set at $42.64 to $43.43 and $45.71 to $47.36 (see chart).
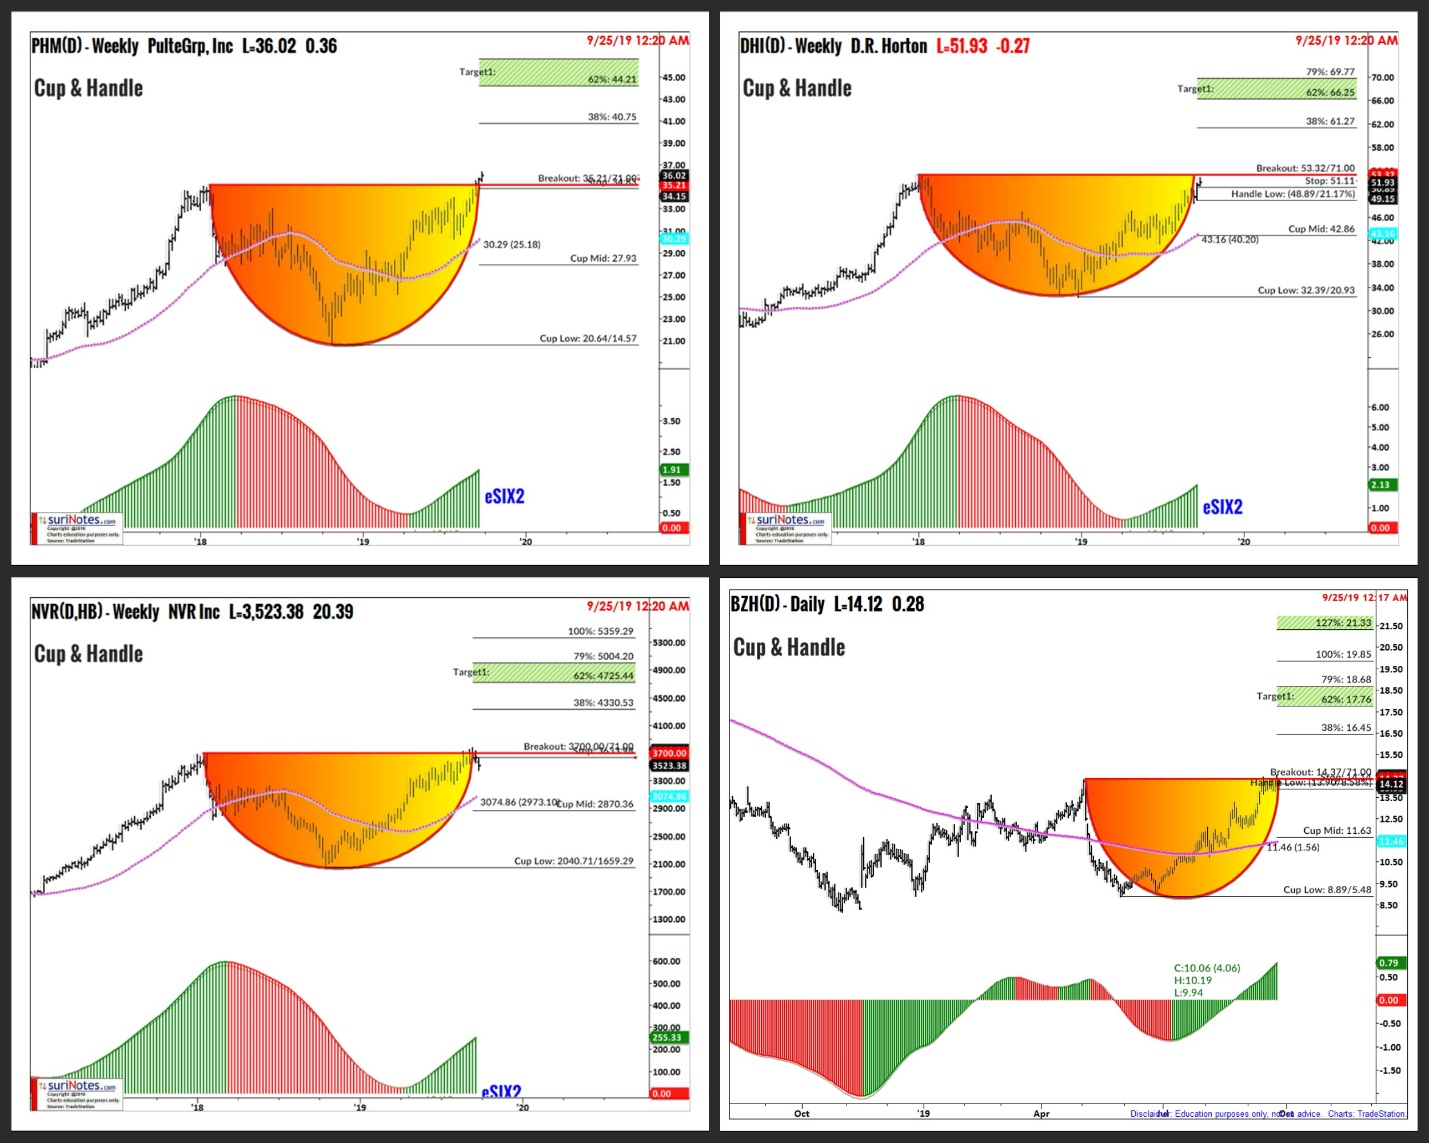
Cup & Handle
The following chart shows a Cup & Handle patterns in PulteGroup Inc. (PHM), D.R. Horton Inc. (DHI), NVR Inc. (NVR) and Beizer Homes (BZH). The Cup & Handle patterns in the afore mentioned stocks are near breakout levels (see chart). They still need to form the handle portion of the Cup & Handle formation pattern to fully succeed.
Find more of Suri’s work at surinotes.com.


