
The recent sell-off in the S&P 500 was pushed by weak manufacturing data, but an equally bearish technical signal is lining up as we enter the historically volatile month of October, writes Joon Choi.
The S&P 500 Index (SPX) was slowly drifting down for a couple of weeks until the Purchasing Manager’s Index (PMI) unexpectedly fell to 47.8 — the worst reading since 2009 — which led to a sharp decline of 1.3%. The 50 level is viewed as a neutral level where manufacturing activities in the U.S. are neither improving nor deteriorating, below 50 indicates contraction. The adverse reaction to the latest PMI reading continued throughout the week, with the equity index down an additional 1.8%.
PMI it is regarded as one of the most reliable leading indicators for assessing the prevailing direction of economic trends in manufacturing. Once again, investors are worried that the U.S. may slip into a recession soon. This fundamental outlook is backed up by a bearish formation that may be a precursor for equity weakness in the ensuing quarters.
Three wave count
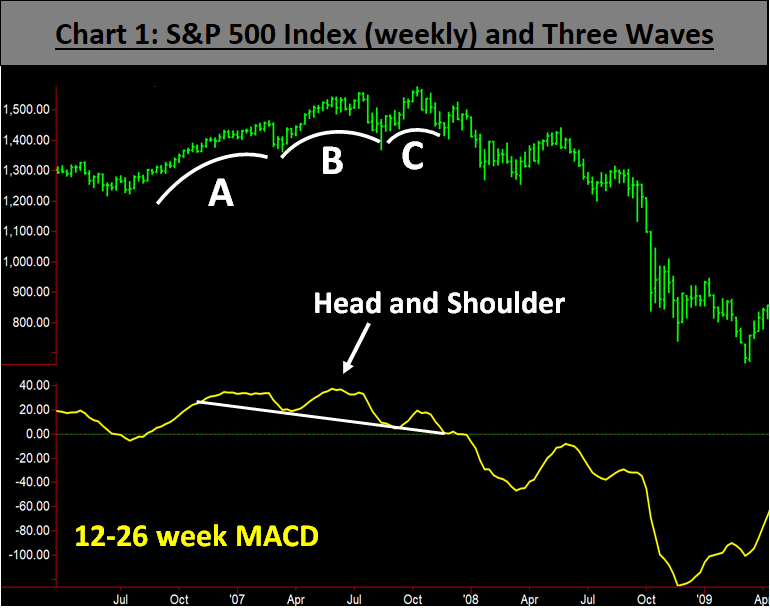
In the technical analysis community, waves are used to detect a looming trend reversal inflection point. Specifically, many use the three-wave count; meaning that when an underlying market makes three successively smaller waves, a trend reversal may not be far ahead. For example, the S&P 500 Index experienced such waves in 2007 on its weekly chart (wave B is smaller than A and wave C is smaller than B in Chart 1 below). In addition, its 12-26 week MACD formed a head and shoulder formation which also preludes a possible selloff.
Current Chart Formations
The S&P 500 Index’s weekly chart resembles the example above where three rising waves are present along with a head and shoulder formation in its 12-26 week MACD (see chart 2 below).
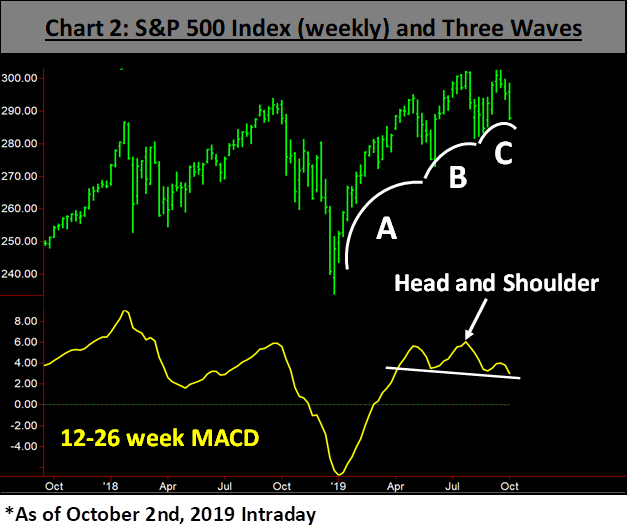
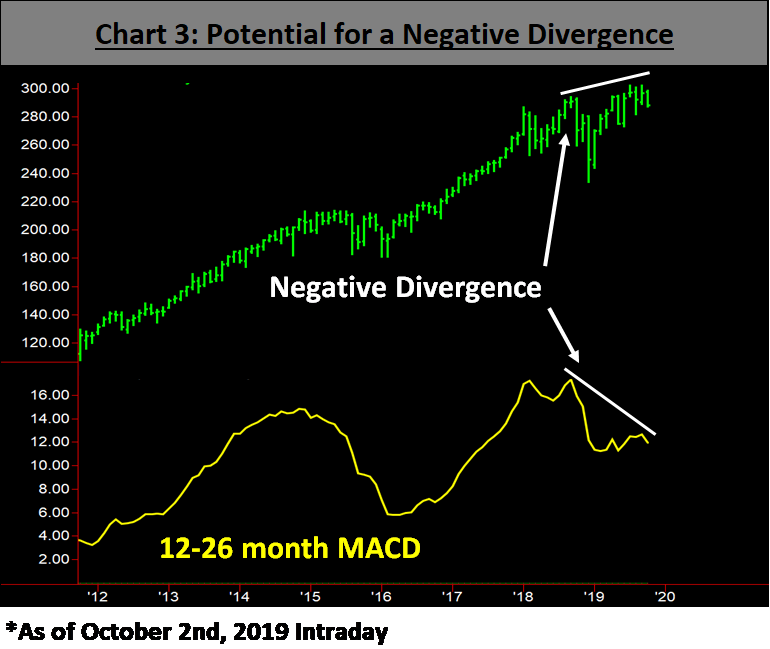
If history repeats itself, this formation does not bode well for equities in the near term. An additional troubling formation is found in the S&P 500 Index’s monthly chart. Although we are only two days into October, SPX is diverging from its 12-26-month MACD; leading to a negative divergence (see chart 3 below).
Conclusion
October is off to a volatile start and we may be in for further instability in equity prices as the SPX weekly chart above is pointing to a sizable selloff. Furthermore, if October ends in a sour note the SPX monthly chart will complete its negative divergence versus its MACD. It appears likely that the Fed will again reduce short-term interest rates later this year in light of an unexpected downside surprise in the September PMI reading. In addition, the Chinese government may not budge on U.S. trade demands and wait out another year for election results. I would advise you to stay cautious, weather the storm and prepare for a buying opportunity.
Sign up here for a free three-month subscription to Dr. Marvin Appel’s Systems and Forecasts newsletter, published every other week with hotline access to the most current commentary. No further obligation.


