
Stocks and long-term Treasury yields are off their early October lows, but the economy and stocks are not yet out of the woods, reports Marvin Appel.
The S&P 500 has not extended its Oct. 2 lows but remains very volatile. For example, overnight Dow Jones Industrial Average futures briefly lost 300 points on negative news about the current trade talks with China. Although they recovered in short order, trade remains a cloud over the stock market.
There is little evidence that China is prepared to change its mercantilist trading policies that have worked so well for them over the past 40 years, so the only outcomes I can foresee are failed talks or a de facto surrender from the U.S. side. Failed talks would cause a further 6% decline in the S&P 500 to retest the 2750 area where it bottomed in June (also on trade news) while a U.S. declaration of trade peace would probably be good for a bounce of similar magnitude.
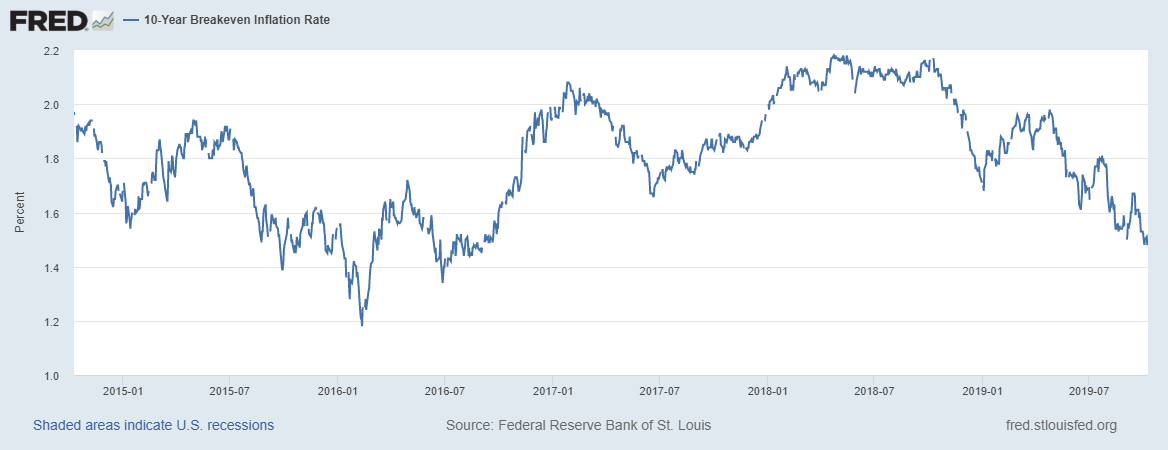
The Treasury market is still far from signaling optimism about the economy, however. For example, the chart below shows that difference between the yields on 10-year nominal Treasury notes and 10-year TIPS (Treasury Inflation Protected Securities), which is the level of inflation that has to occur in the next 10 years to generate the same total return from both. It’s at 1.49%, its lowest level since 2016. The Consumer Price Index (CPI) reported no change in September and just a 1.7% rise over the past 12 months.
Another area of the bond market that is signaling caution is securitized floating rate bank loans. They are subject to a double whammy: First, as the Fed cuts interest rates, the yields they pay decreases. Second, as the economy slows, the credit risk of floating rate borrowers (who are generally below investment-grade) increases.
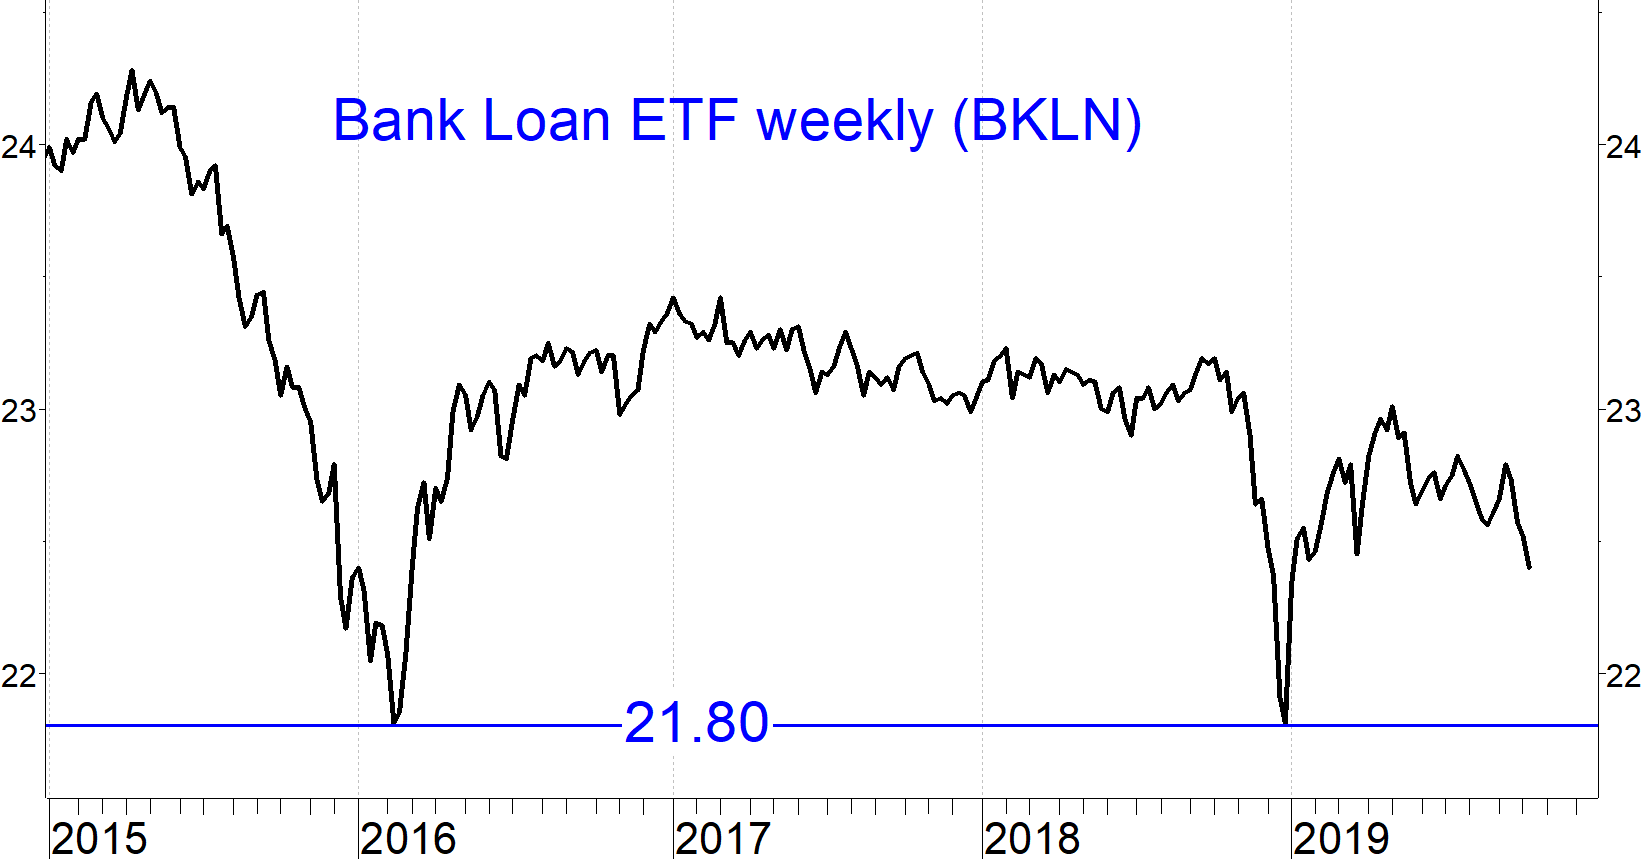
The chart below shows that at the time of the past two recession scares in 2016 and 2018, the Invesco Senior Loan ETF (BKLN) bottomed at $21.80. BKLN has been in a downtrend since early 2017 but is still more than 2% above the major $21.80 support level. Our floating rate loan fund timing models remain on buy signals for now, so it is too early to worry. Nonetheless, floating rate loans are a potential market bellwether in addition to corporate high yield bond funds and, in the case of floating rates, the indications are neutral at best.
Our high yield bond fund timing model came close to generating a sell signal earlier this week, which would have been all around bearish. But gains in stocks and rising 10-year Treasury note yields late last week have pushed a high yield sell signal further away, so that warning is currently withdrawn.
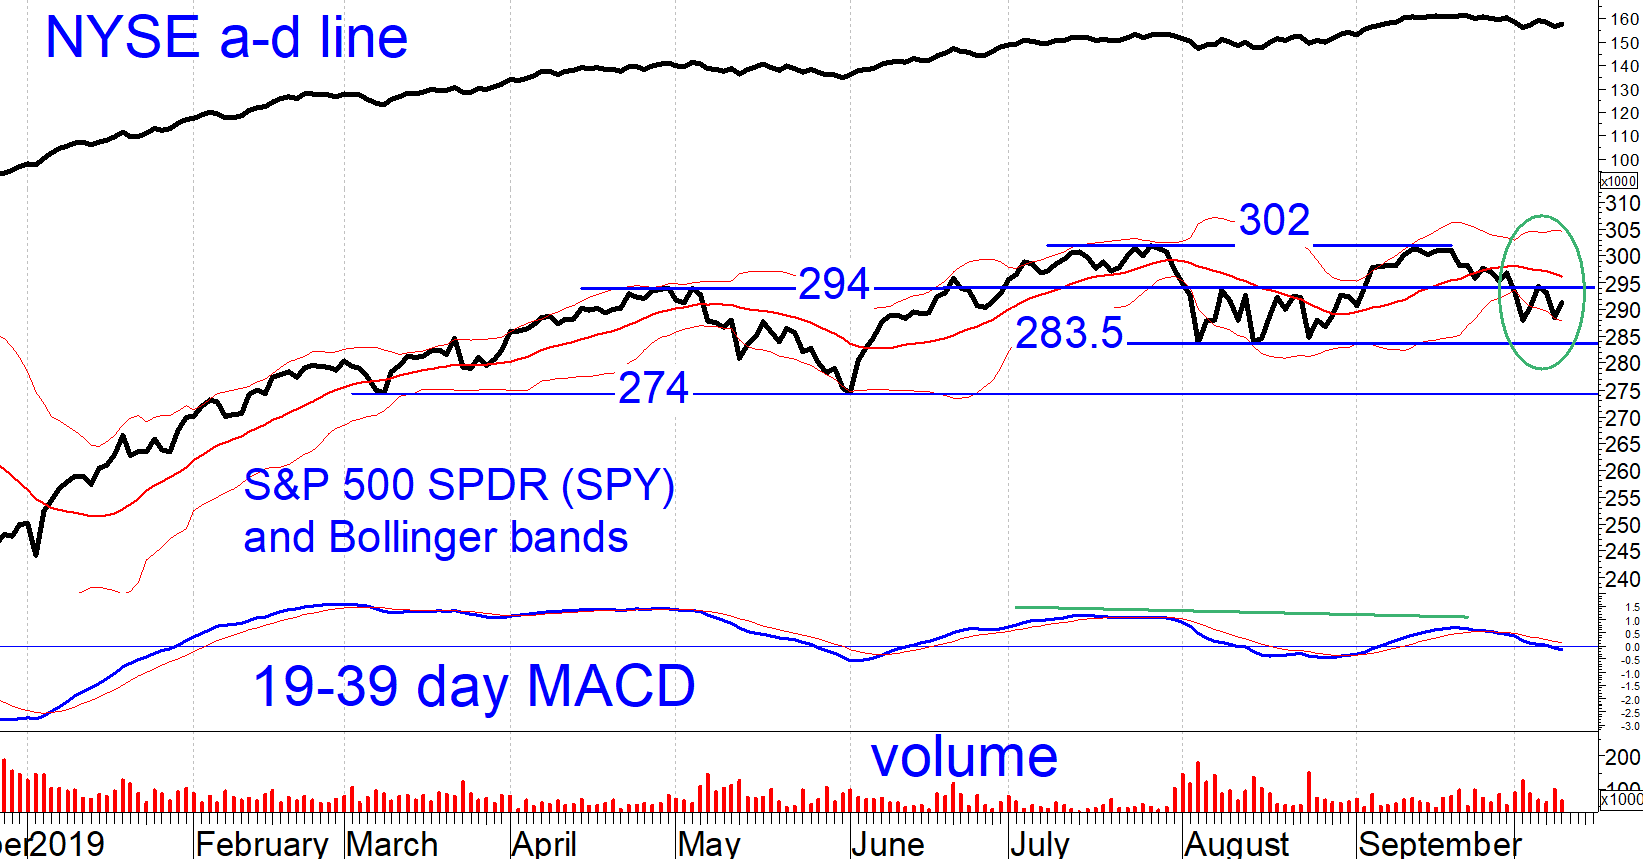
It’s hard to believe that the S&P 500 Index has moved overall sideways since the end of April. The MACD indicator is on a sell signal, as is our main U.S. equity timing model. However, our secondary equity model is on a buy signal. The SPDR S&P 500 ETF Trust (SPY) closed today at 293.24, slightly below the 294 area that served as resistance in August and earlier this month (see chart below). The 294 resistance area is also reinforced by the middle Bollinger band. Above 294, 302 is the next area of resistance.
As I noted last week, I view 284 as a support area good for some bottom fishing, and one at which covered SPY call writing would be attractive.
For now, with our equity timing models mixed, I expect continued overall sideways action with above-average volatility. This is not an environment in which to chase rallies, although judicious bottom-fishing could be profitable. I expect to ride out the rest of October with our clients having portfolios of below-maximal volatility.
Sign up here for a free three-month subscription to Dr. Marvin Appel’s Systems and Forecasts newsletter, published every other week with hotline access to the most current commentary. No further obligation.


