
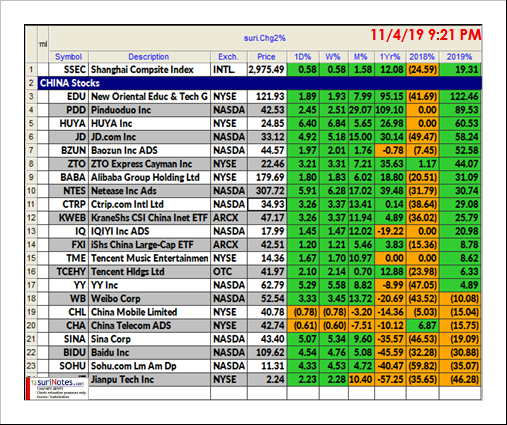
After a dismal performance in 2018 (-24.59%), the Shenzhen Composite Index (SZSC) and Shanghai Composite Index (SSEC) are the world's best performing major stock indexes in 2019. As the fears of the trade war's impact eased in the November meeting between China and the United States, China stocks may see a further positive outcome in the next few weeks.
The table below shows the year-to-date performance of major Chinese Stocks.
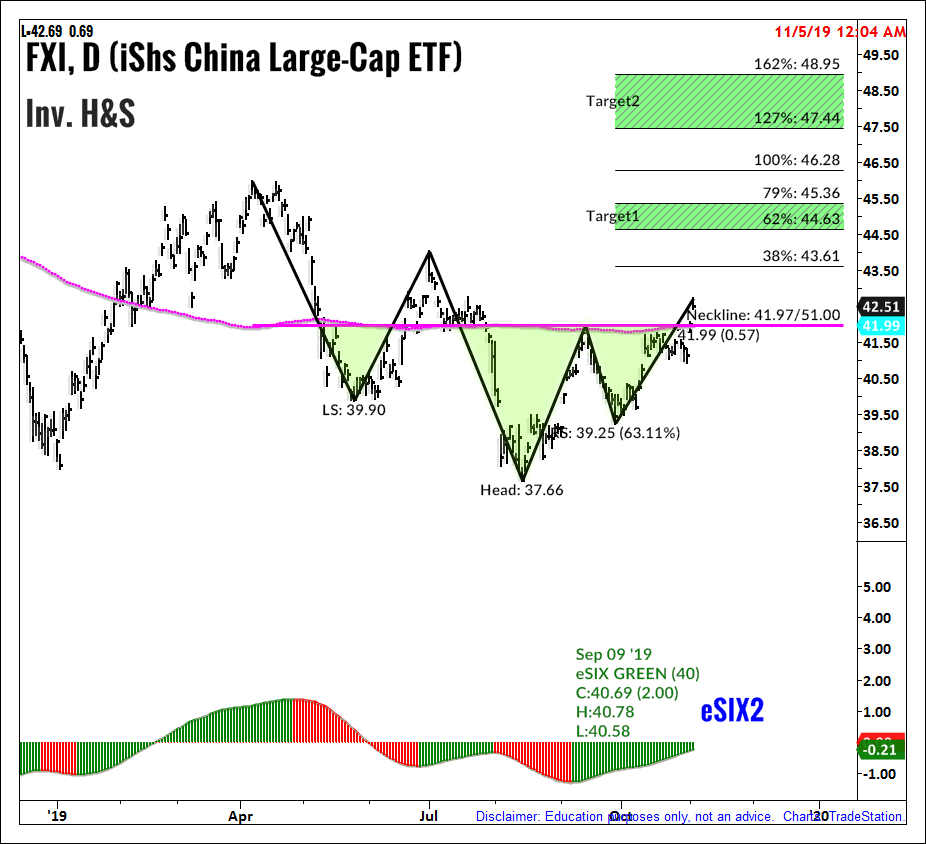
Inverse Head & Shoulders Pattern
One of the most popular chart patterns in market analysis is the Head and Shoulders pattern. The Head & Shoulders pattern forms near market tops in an established sideways to up-trending or bullish market. Head & Shoulders reverse the prior uptrend and follow a bearish or downtrend from its breakdown. These patterns are signified by three successive peaks (tops) resembling two shoulders on both sides and a head in the middle. The head is the largest of the three peaks. An Inverse Head and Shoulders pattern is the head and shoulders pattern upside down (mirror image) and follows a similar structure and trading rules in reverse. The Inverse Head & Shoulders patterns are also reversal patterns and form in established downtrends.
The iShares China Large-Cap ETF (FXI) has been trading in an Inverse Head & Shoulders pattern since April 2019. A long trade is entered when price is closed above the neckline at $41.97. Profit targets are at $44.63 and $47.44. An initial stop is placed below the right shoulder's low at $39.25 (see chart below).
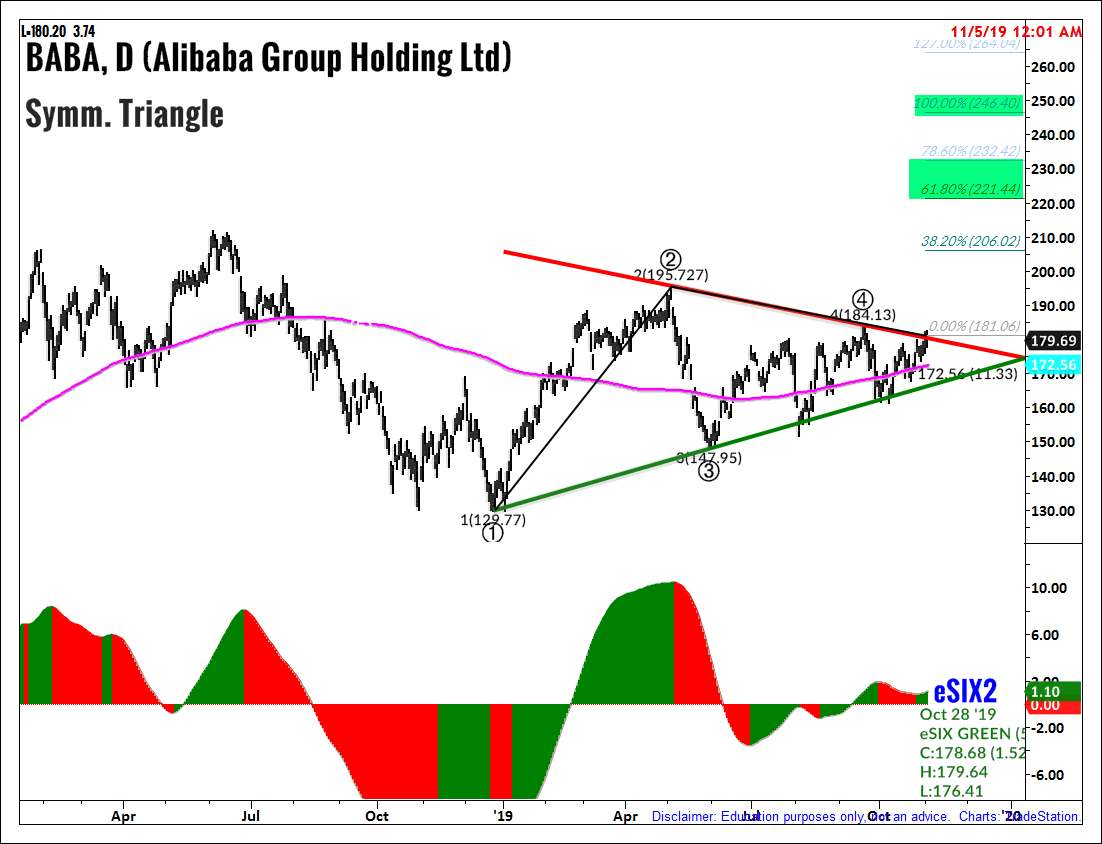
BABA Symmetric Triangle Pattern
Symmetric triangles can be characterized as areas of indecision. Market price action pauses during these indecision periods as the forces of supply and demand nearly become equal. Volume tends to be diminished during the consolidation phase. Eventually, a resolve (breakout or breakdown) from the upper or lower trend lines will result and prices will explode out the Symmetric triangle.
Usually, Symmetric Triangles break in the direction of its prior trend, hence signifying its continuation pattern status. Please note that there are many cases where Symmetric Triangles result in a reversal pattern also after its initial breakout in the opposite direction, giving the trader the opportunity to trade the failure side of the pattern.
Alibaba Group (BABA) has been in a Symmetric Triangle pattern from January 2019 to November 2019 between $129 and $195. A long trade may be entered when price is closed above upper trendline at $181. Targets are placed at $206, $221 and $232. A stop is placed below the last key pivot level of $160 (see chart).
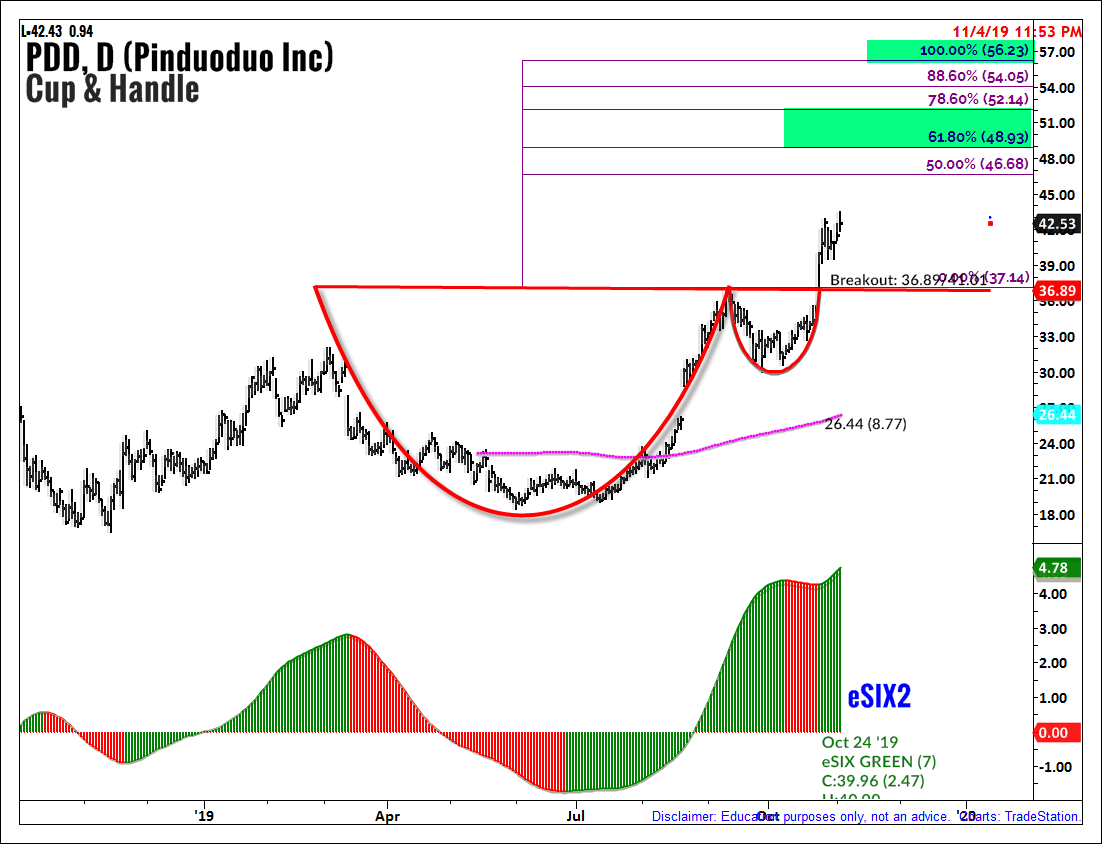
Cup & Handle Pattern
William O'Neil developed the Cup & Handle pattern and it is a bullish continuation pattern. Cup & Handle patterns are a cup-shaped (bowl) price pattern with consolidation period (handle) followed by a breakout. The Cup & Handle Pattern is usually formed in an uptrend followed by a price breakout as a continuation of the prior trend.
Pinduoduo, Inc. (PDD) developed a Cup & Handle pattern from March 2019 to October 2019. The Cup & Handle breakout level is above $36.89. Targets are $48-52 and $56. A stop is placed below the handle low at $30 (see chart).
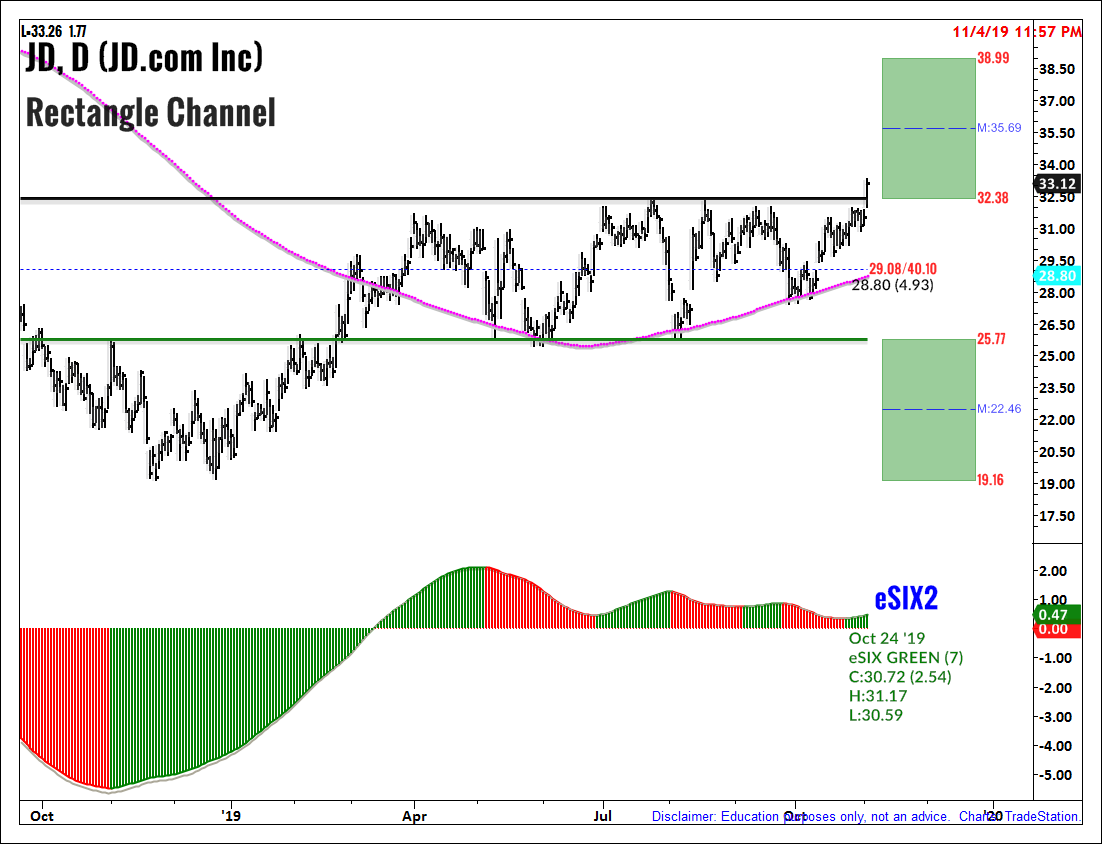
Rectangle Channel Pattern
Rectangle Channel patterns are formed by price action between two key trendlines bound by multiple equal (near) highs and lows. The duration of the pattern can be a few days to several months. Longer duration patterns are considered to be more reliable. The pattern must have at least two pivots (equal highs or equal lows) on each of the trendlines. The price breakout can occur in any direction from the pattern, but the general belief is price may breakout in the same direction as the prior direction before the pattern formation. The volume inside the pattern is non-decisive, but volume tends to increase during the breakouts.
JD.com, Inc. (JD) has been forming a rectangle channel pattern between $25.77 and $32.38 from April 2019 until November 2019. A close above $32.38 with the positive trend is considered to be a breakout. A long trade is entered above the breakout level $32.38 with targets at $35.69 and $38.99, and with a protective Stop at $29 (see chart).
Find more of Suri’s work at surinotes.com


