
The S&P 500 has been in a bull channel all year but may have more room to climb, writes Al Brooks.
The E-mini S&P 500 has rallied to the top of the yearlong bull channel on the weekly chart. After six consecutive bull bars, a one- to two-week pullback will probably begin in November.
The E-mini S&P 500 futures is still rallying from the June outside-outside (OO) buy signal on the monthly chart (see below). There were consecutive outside bars in June. That is a breakout mode pattern.
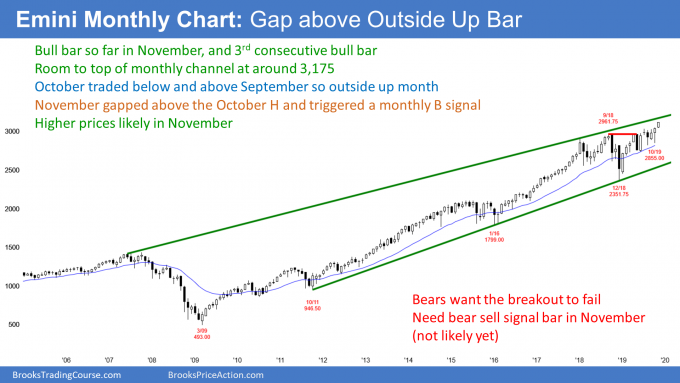
Since the monthly chart has been in a bull trend, those bars formed an “OO” bull flag. July triggered the buy signal by going above the June high. The minimum objective was three months of sideways to up trading. But it is important to note that the breakout usually does not last much more than about five bars. November is now the fifth month. So far, there is no sign of a top.
November is a bull trend bar on the monthly trading at the high of the month. If it looks like this at the end of the month, traders will expect at least slightly higher prices in December. The next target is the top of the 12-year bull channel at around 3,175. There are different channels on the weekly and daily charts and those have lower targets.
Next pullback likely to be minor
If November reverses down and closes on its low, November would be a sell signal bar for December. It would be a reversal down from the third leg up from the Christmas 2018 low and therefore a small wedge top.
But the yearlong bull trend has been strong. If there is a reversal down in the coming months, it will probably be similar to the three minor reversals in 2019. Each lasted only one or two bars.
This would be the fourth pullback. Trends tend to weaken as they age. Therefore, the next reversal might last a couple months.
However, the best the bears can probably get over the next few months is a test of the August and October lows at around 2800. They would then need at least a few sideways months before they would have a reasonable chance of a bigger reversal down. Therefore, traders should expect more sideways to up trading for at least a couple months.
The weekly E-mini chart is particularly interesting. This week was the sixth consecutive bull trend bar (see chart). That is unusual, especially late in a bull trend. Traders should expect a one to two-week pullback to begin by the end of November.
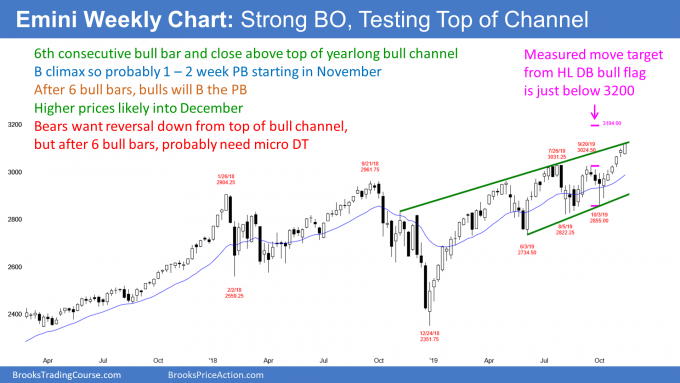
However, there have been six bull bars with each low above the low of the prior week. There is a seven-bar bull micro channel, which means that the bulls have been eager. They therefore would like an opportunity to finally buy below the low of the prior week. Consequently, the next pullback will probably only last one to two weeks. After that, at a minimum, traders should expect a test of the high.
Near the top of the yearlong bull channel
Where will this rally end? The E-mini on Friday closed slightly above the top of the yearlong bull channel. Tests of resistance are rarely perfect. The momentum up is strong enough for traders to expect at least a slightly bigger break above the top of the bull channel.
But channels reliably contain trends. The bulls look to take profits and the bears start to sell around the top of the bull channel. At the bottom of the channel (the bull trend line), the bears will take profits and the bulls will buy again. Traders should therefore expect a one to two-week pullback to start within a couple weeks.
Bull breakout above the bull channel is unlikely
The E-mini obviously can break far above the bull channel and begin an even stronger bull trend. But that happens only 25% of the time. Most the time, traders should think of a bull channel as a bear flag.
There is a 75% chance of an eventual break below the bottom of the channel on the weekly chart. That is currently around 2930. Once that happens, the bull trend usually evolves into a trading range.
How does the reversal down occur? Usually there is a break above the top of the bull channel. Then, within about five bars (weeks), the breakout fails. Traders look for a reversal down to the bottom of the channel (the bull trend line).
The bulls will want another leg up from the bull trend line. However, the bears will want a break below the bull trend line and the end of the bull trend. That means either the start of a trading range or a bear trend. A test of the bottom of the channel is probably more than a month away.
The daily E-mini chart did something unusual last week. Through Thursday, there were five consecutive bull trend bars in a tight trading range (see chart). When the bulls are so bullish, the bars typically go up and not sideways.
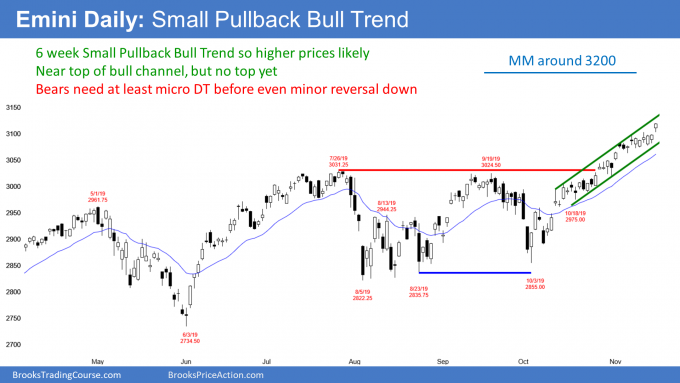
On Friday, the E-mini finally broke above the tight trading range. Six consecutive bull bars are unusual, but there is no sign of a top. Traders therefore belief that the rally will continue at least a little longer. For example, the top of the yearlong bull channel on the weekly chart is now around 3125. The top of the two-month bull channel on the daily chart is just below 3150. A measured move up from the August/October bottom is around 3200, which is just above the top of the bull channel on the monthly chart.
Is Pullback Due?
There were three small reversal attempts over the past 10 days. Each failed and formed a High 1 bull flag. Instead of a wedge top, the rally since the October low has been in a Small Pullback Bull Trend. That can last a long time.
However, look at the rallies in February, April, July and September. Each was in a tight bull channel that lasted a month or so. Each was then followed by a 5% to 8% correction. The tops of the rallies created the top of the bull channel on the weekly chart.
The current rally looks like the earlier rallies and the E-mini is once again near the top of the weekly bull channel. Will there be a correction this time? Eventually, yes, but the weekly chart has had six consecutive bull trend bars. Therefore, traders will probably buy the first one- to two-week selloff. The bears will likely need at least a small double top before then can get a selloff to the bottom of the bull channel. Traders should expect higher prices, even if there is a two-week selloff first.
Trading Room
Traders can see the end of the day bar-by-bar price action report by signing up for free at BrooksPriceAction.com. I talk about the detailed E-mini price action real-time throughout the day in the BrooksPriceAction.com trading room. We offer a two-day free trial.


