
The CFTC’s Commitments of Traders (COT) report works at the extremes by revealing market imbalances, notes Andy Waldock.
The Commodity Futures Trading Commission didn't update the Commitments of Traders (COT) report this week due to the Thanksgiving holiday. We'll review a few of the general concepts behind our approach to the COT report and consider our open soybean oil position.
The COT data is often overlooked as a data stream. Overanxious, novice traders view the weekly report as old news, and I'm the first to agree with them on a day to day basis. However, we don't engage every market, every day, and therefore avoid the misapplication of COT data.
COT data is essential at the extremes. Extreme readings in the data indicate the magnitude of the disagreement on forward pricing between the industries associated with a commodity's production or consumption vs. the large speculators piling into a trending market.
These behavior patterns manifest themselves in the COT data by tracking both the net and total position sizes of the commercial and speculative traders. Commercial traders execute their futures trades according to their business plans. The more the underlying prices for their specific commodity move into the profit column, the more action they'll take in the futures market to book the forward profits. Conversely, the large speculators pyramid their position into a market's peak or trough. Reverse pyramiding leaves the speculators holding their most significant allocations at the market's most inopportune moments. Early speculators riding positions will take their profits and exit the market upon its reversal. Most speculators will end up racing each other to the exits.
We use the COT data to determine the market's imbalance in several ways. First, we can track the reported net positions against their historical records. The historical records help us determine the total industrial capacity for the given commodity. Total capacity is essential because once the industrial needs are met, the commercial traders will step aside. Speculative overrun is what happens in a real bubble. We find the 52-week highs and lows to be more representative of current market action.
We also track the commercial traders' pace of buying or selling compared to their recent activity. We want to know when the commercial traders are especially anxious to get business done at the current prices. We developed a paint bar in TradeStation for our MoneyShow COT Master Class this spring, which allows users to plot the commercial traders' past vs. current behavior by the standard deviation. We've found this to work exceptionally well when used in conjunction with a new 52-week rolling high or low.
We view the COT data as big business building support and resistance. There is far too much news to consume and too many variables to account for in any individual market for one to process efficiently, let alone following every market. However, if we view the COT report through the actions of the commercial traders, we can place most of an industry's research and price forecasting on our side at the market's most critical time.
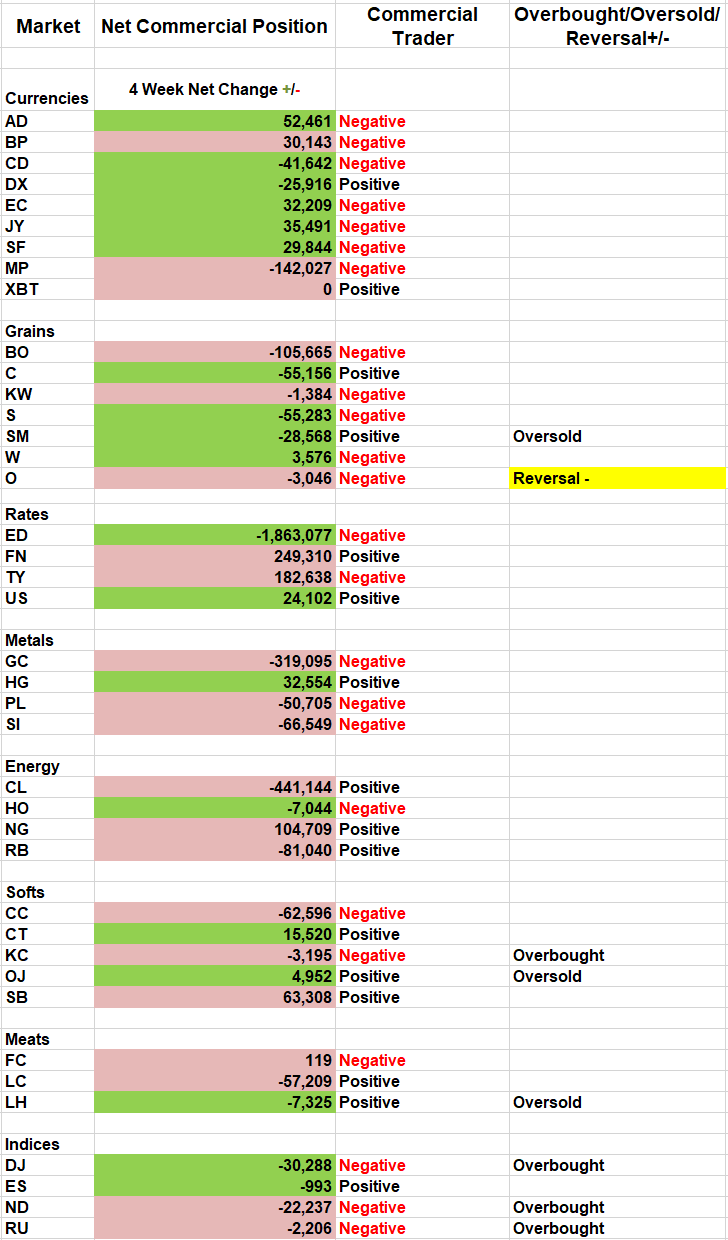
Our current soybean oil short position is an excellent example of this methodology. Commercial traders had been net sellers five straight weeks as speculators continued to push prices higher. Commercial traders were anxiously selling as prices climbed above 30.50. We published our first short sale signal on Nov. 6, on the open at 31.78, and followed it up with a weekly COT short sale signal on Nov. 18.
The markets labeled overbought or oversold on the COT worksheet are all exhibiting the setup that puts us on reversal alert (see table above). The conflict between the commercial traders and the speculators has reached our threshold in markets that have become overbought or oversold. We expect these conflicts to resolve in favor of the commercial traders' collective forecasts.
Finally, we won't take action until the market shows a sign of reversal, and when we do enter, we'll be sure to place a protective stop-loss order at the market's peak or trough.
Register at WaldockTrading.com for access to back issues. Here is what Andy had to say about seasonality and the COT Report at the TradersEXPO New York. Visit Andy Waldock Trading to learn more. Register and see our daily and weekly signals archive for entries and stop loss levels sent to our subscribers.


