
The tone and scope of the recent correction is different than all other in this long bull run, and could signify a more significant move, reports Al Brooks.
If you have been reading my reports over the past few years, I predicted several 5% to 10% selloffs, but I always made the point that the E-mini S&P 500 was soon going higher. Each of those selloffs was likely to be pullback in a bull trend. I am not saying that now because of the size of last week’s selloff and the context.
This past week was unusual. What’s going on? I discuss the technical factors below. There are some non-technical things also contributing to the selloff. The obvious two are the Coronavirus and Bernie Sanders. Both require a repricing of assets. Everything now is less valuable. Obviously, if Sanders is elected and if he was able to get all that he says he wants, the stock market would fall.
I want to talk more about the Coronavirus. As you may know, I am an MD. I began my career as a medical scientist and have a lot of experience in the medical community and with major university medical centers. This experience influences my thoughts.
A pandemic is a vague term, but I think that we are either in one or that there will soon be a consensus that one has begun. The term does not matter. What matters is that the Coronavirus outbreak is changing everyone’s behavior in ways that reduce consumption and production. The result is that companies earn less and are less valuable. The average price of all assets, including stocks, falls.
Possibly millions will be affected
The Coronavirus pandemic could be vastly worse than what the experts are saying. We are fighting it as hard as we can with all that we have, but what we have is not enough to win. At the moment, all we have is quarantining sick people, hand washing, and avoiding sick people.
This containment approach is the only current solution, but it has very little chance of working. And it has been failing. A vaccine is the only answer, and we need billions of doses. That means the solution won’t come until the end of the year.
Do the math. The flu kills 500,000 people worldwide every year. This is true even with an available vaccine. Incidentally, vaccines are only about 70% effective.
Coronavirus is equally contagious and 10 times more deadly. That means it is not unrealistic to expect several million people to die this year.
Also, we now know that each patient infects an average of four people. Assume that it takes seven days for an infected person to get sick and to infect four more people. With a little math, you must wonder how many people worldwide will be infected before there is a vaccine.
If 3 billion people get sick and 2% die, that is tens of millions of dead. This could be the worst pandemic since the 1918 flu, which killed 50 million people. I know that sounds crazy, but that is what the math looks like to me.
Every year we get flu shots. We may now start to get annual flu and Coronavirus shots.
A vaccine is the only solution
The Coronavirus problem will be solved by the end of the year when a vaccine becomes available. If the pandemic is temporary, how much damage can it do? If I am right and it is a much bigger problem than what the experts are saying, it could easily lead to a 30% to 50% correction this year.
It takes time for information to come in, and it might be more than a month before experts begin to suggest that it could kill millions of people. There could be several strong attempts to resume the bull trend in the meantime. But if this is anywhere as big a problem as it could be, it could result in a serious bear trend.
Part of the reason for the size of the selloff this week has been President Trump’s response to the outbreak. On Wednesday, he basically said that it is not serious. Nobody believes him. The experts are telling the captain that the Titanic has hit an iceberg, but the captain is saying everything will be alright.
He has also criticized government scientists for talking about the outbreak and the dangers we face. He stopped Dr. Fauci from going on the talk shows this Sunday. His fear is that their comments will spook the market and aggravate the selloff.
Hiding the truth does not make it go away. President Trump does not have a clue about how big this problem could be, and he has a history of ignoring experts. He therefore will not manage it well and the damage could be much more serious.
Don’t forget the inverted yield curve
The 10-year Treasury note yield fell to less than the two-year yield in August 2019. That is an abnormal situation and it is called an inverted yield curve. All seven recessions since 1970 were preceded by an inverted yield curve. Each recession came between five and 17 months after the inversion. We are now in that window. The yield curve is telling us that a recession is likely, probably this year.
Recessions are typically preceded by a stock market selloff coming about six months earlier. If we know there will probably be a recession and that it will be preceded by a stock market selloff, this week is a credible candidate for that selloff. Consequently, there is an increased chance that this selloff will lead to a recession later in the year.
Sometimes a stock market selloff can be a major contributing factor to a recession due to the wealth effect. That is the increase or decrease in spending due to a change in our perceived wealth.
If the stock market sells off, people who own stock will have less money. They will buy fewer things. Companies that make those things will sell less and make less money. The earnings drop exacerbates the selloff.
As they make less money, they cut back. One of the most common ways is to lay employees off. That means fewer consumers buying things.
Recession Defined as 2 quarters of negative GDP
The result of all of this is that the economy can shrink instead of continuing to grow. GDP is the most common measure of economic growth. If it is negative for two consecutive quarters, then there is officially a recession.
Two quarters means six months after the start of the shrinkage of the economy. If the recession comes later this year, as I think is likely, the economy begins to shrink at least six months earlier. This might be the start.
Is this a crash?
No, but crashes occur almost every day. A crash is just a lot of bars in a strong bear trend. You can find them on the one-minute chart several times every week. On even smaller time frames, they happen every day.
While those are crashes, that is not what people mean when they talk about a crash. In 1929, the stock market lost almost 90% of its value over three years in a bear channel. In 1987, it fell almost 25% in a day. Those are the only two times in the past 100 years when there is a widespread agreement that the market crashed.
The E-mini crashed last week on the five-minute chart and on the 60-minute chart. It has only fallen 16% in one week on the daily chart. Therefore, it has to fall much further before traders will refer to the selloff as a crash. Crashes are rare and therefore this will almost certainly not grow into a crash.
Why was it so fast?
The selloff was very fast. That is because 80% of equity trading and 90% of futures trading is done by computer algorithms. They instantly make decisions and execute trades without hesitation. They chase momentum and will continue trading in one direction until there are not enough computers left to take the other side.
Moves are also exaggerated by options trading. For example, in a big down day, half of the selloff can be caused by option gamma. That is the rate of increase in put values as the market falls.
Option selling firms are huge. They basically insure all institutions, which buy puts to protect their portfolios. If the market falls, the value of puts increase at an increasing faster rate. That is the gamma effect. Option selling firms must hedge their short puts. They do so by selling stocks and futures, exacerbating the selloff.
This is probably not just another pullback
For the past 10 years, traders have bought every 10% to 20% pullback and made money. Well, here’s their chance. If you have traded for 10 years or less, you have never seen this before. I have been trading for 34 years and I believe this is not going to snap right back like the E-mini did at Christmas 2018.
But I do believe markets will rally strongly, enough to make traders wonder. That kind of reversal is rare and therefore unlikely. Also, this selloff was much stronger. There is a 70% chance that there will be a lower high and a second leg sideways to down. Also, there is a 30% chance of a 30% to 50% correction this year.
The definition of a bear market is a 20% drop from the high. So far, the E-mini has fallen 16% and recouped a third of that. Here are some guidelines as to what to expect if the market falls 20%. Once the market falls 20%, it usually falls more. There have been more than 30 corrections of 20% or more since 1927 and the average was 30%. The final low comes after about a year after the selloff begins. It is important to note that it takes almost two years before there is another new all-time high.
I have been saying for a couple years that the market will be in a trading range for about a decade. Therefore, even once there is a new high, it will probably not last. Traders should expect reversals for many years.
There will be at least a couple major selloffs in the next 10 years. That is frustrating for investors but good for traders. For example, if a trader buys a 50% pullback and holds it until there is a new high, he will double his money. If he buys a 30% selloff and holds until there is a new high, he will make almost 50%.
This is difficult to do, but it will probably be the best approach for many years. Investors will probably be disappointed by the lack of gains like they were in the decade long trading ranges of the 1970’s and the 2000’s.
Remember January 2018
In late 2017 and in the first few weeks of 2018, I repeatedly made the point that the stock market had never been that overbought on the daily, weekly and monthly charts in the history of the Dow or S&P. I said that there was going to be a 5% to 10% correction within weeks. The E-mini fell 10% over the next month.
Why did I say only 10%? Because as climactic as the market was, it was also in a strong bull trend. Traders did not have a chance to buy even a 2% pullback in a long time. The odds were high that they would buy a 5% to 10% pullback.
However, when there is an unusually extreme buy climax, the market gets exhausted. There is typically another leg up after the first pullback and that leg often becomes the final rally before a bigger selloff.
One could argue that the 2018/19 trading range was the pause after the first buy climax and the 2019 rally was the second and final leg up in the 10-year bull trend.
It is too early to know, but last week’s selloff is consistent with this. There was the most extreme buy climax in history followed by a two-year pause, then another extreme buy climax in 2019, and finally an unusually strong selloff this week.
How low can the market go?
I believe that there is a 30% chance of at least a 30% selloff this year. It could be more. Look at the 50% selloff in 2002 and the 60% selloff in 2009. It is foolish to think that selloffs of that size will never come again. They will.
Whether or not this is the start of a 30% to 50% pullback, I have been saying for a couple years that this unusually climactic rally will probably have around a 50% selloff starting within five years. This has nothing to do with the Coronavirus. It was purely technical. You never know what black swan would cause it. Coronavirus is a good candidate.
I have said that the bottom of the 2014 – 2015 trading range was a reasonable target. The E-mini tried to reverse there and again in late 2017. The bottom of prior reversal attempts are magnets for later reversal attempts. That 2017 trading range low is around 1800, which would be about a 47% selloff from the current all-time high.
Many stocks forming bearish patterns
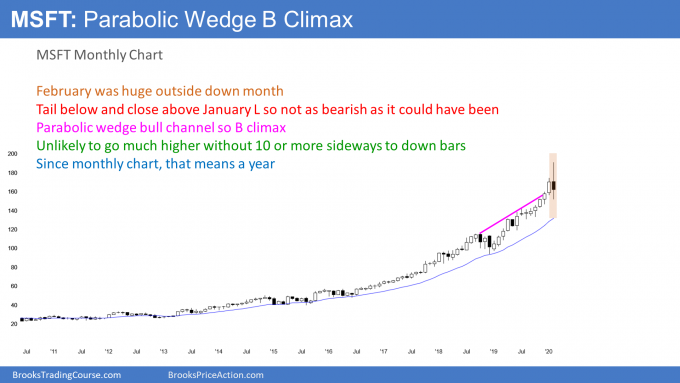
Many major stocks are forming bearish patterns on the monthly charts. Microsoft (MSFT) has a huge bear reversal bar at the top of a parabolic wedge buy climax (see below). That makes higher prices unlikely for many bars (months).
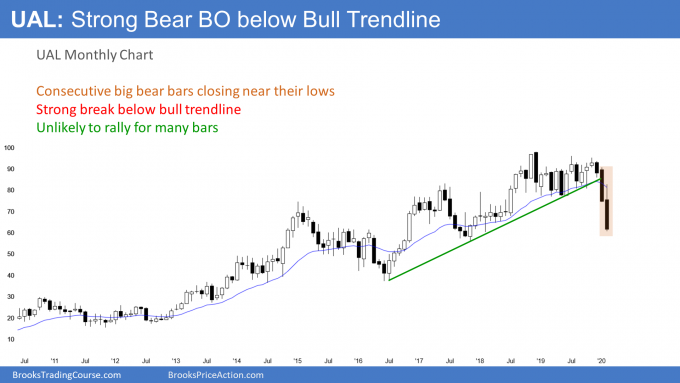
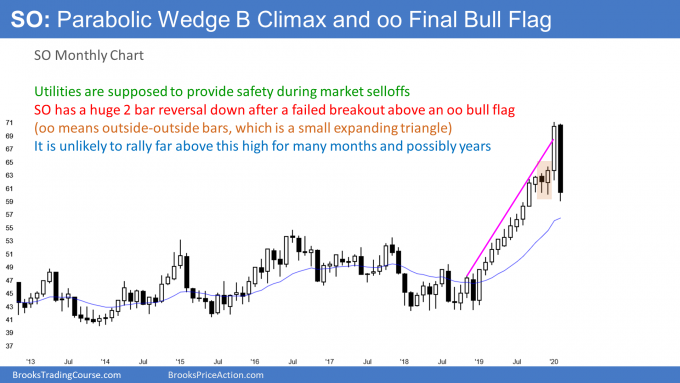
United Airlines (UAL) and Southern Company (SO) have also experienced a parabolic wedge climax (see below).
There is a 50% chance of a deep correction that could last a year or more. Apple (AAPL), Amazon (AMZN), Alphabet (GOOGL), Mastercard (MA), Costco (COST), Nike Inc. (NKE), Coca Cola (KO), PulteGroup (PHM), Lockheed Martin (LMT), Canadian Pacific Railway (CP), Eli Lilly (LLY) and Duke Energy (DUK) have similar patterns.
Other stocks are breaking below major topping patterns. For example, Exxon Mobil (XOM) has a big breakout below a 15-year head and shoulders top. That makes it likely that it will be sideways to down for many months. Ford (F) and Carnival Corp. (CCL), and many others are having similar breakdowns.
This means the selloff is broad and affecting many sectors. That increases the chance of significantly lower prices over the next year. At a minimum, it will make it difficult for the market to make a significant new high this year.
Trading Room
Traders can see the end of the day bar-by-bar price action report by signing up for free at BrooksPriceAction.com. I talk about the detailed E-mini price action real-time throughout the day in the BrooksPriceAction.com trading room. We offer a two-day free trial.


