
The sharp rebound in the E-mini has entered into bull territory, though still likely bear market rebound, reports Al Brooks.
The E-mini S&P 500 has reversed strongly for three weeks. There is no top yet. However, the rally is probably a bull leg in what will become a trading range. Traders should expect a two-week bear leg to begin by the end of the month.
The E-mini S&P500 futures has been trading sideways on its monthly chart for more than two years (see chart below). February and March formed a pair of surprisingly big bear bars and began a bear trend reversal. A bear surprise typically has at least a small second leg sideways to down.
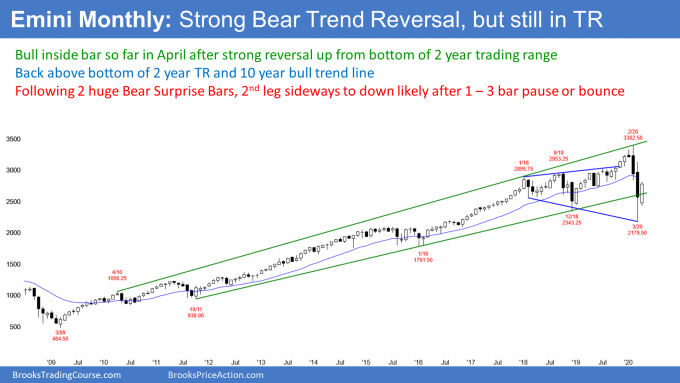
But the bounce sometimes will erase much of the selloff before the second leg begins. Rarely, the rally will go to a new high before there is a second leg down.
There is a 70% chance that this reversal will fail within three months. Traders should then expect a test down to around the 2018 or 2020 lows.
Bulls Hope Bull Trend is Resuming
The bulls have good reasons to be hopeful. The monthly chart is still in a trading range. Every bear trend since the Great Depression ended at a monthly bull trend line. This selloff reversed up strongly from below the 10-year bull trend line.
It also reversed up from below the bottom of a two-year trading range. That trading range is an expanding triangle. A triangle in a bull trend is a bull flag. That means a bull breakout is usually more likely. If this month remains a bull inside bar closing near its high, it would be a buy signal bar for next month.
While all of these factors are good for the bulls, the bear Surprise Breakout is more important. It was extremely big and it came late in a bull trend. Also, it followed the most extreme buy climax in history (the 2017 rally). There is only a 30% chance that this rally will continue up to a new high without first having a test back down.
Range will probably form a major topping pattern
The two-year trading range will probably last all year. If so, there will be at least one lower high. It would be a lower high major trend reversal sell setup. Traders will begin to talk about it as the right shoulder of a two-year head and shoulders top. The September 2018 rally is the left shoulder.
Every trading range has both a credible buy and sell setup. However, trading ranges have inertia. They resist change. Consequently, if the bears get a reasonable lower high with a good sell signal bar, they will have only a 40% chance that the signal would lead to a bear trend.
More often, the reversal does not get far and the trading range continues. Traders then watch for the next buy or sell signal.
Does this Mean Pandemic Scare is Over?
As we mentioned multiple times, the market sell-off was a technical move and the Coronavirus was the trigger, not the cause.
It was based on the late 2017 buy climax. The technicals will still determine the next move, though the lasting impact of the Coronavirus pandemic on behavior will also impact markets. Make sure to see our post tomorrow on those lasting impacts and how the Federal Reserve handled the crisis.
The E-mini broke above the two-year trading range in February on the weekly chart but reversed violently down (see chart below). It broke strongly below in March and is now violently reversing up. Since it is now back to the middle of the range, it is neutral.
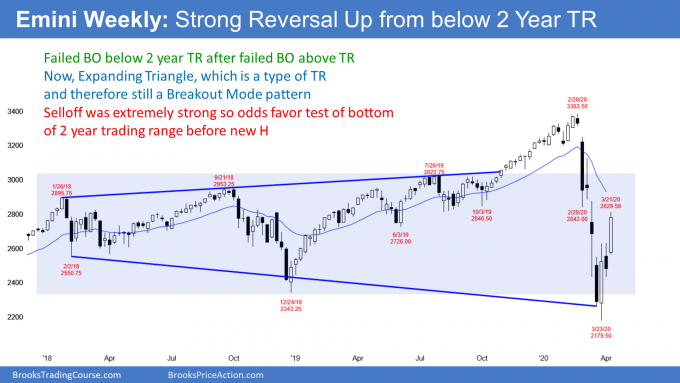
The bulls hope that this rally is the start of a reversal up from an expanding triangle bottom. Their target is a new high.
But the collapse was extremely strong. That makes it likely that this rally will not continue to the high without first entering a small trading range for several weeks.
In fact, after a 34% selloff, the bulls will probably need at least a couple years before they can reach the old high. And even then, because of how extreme the 2017 buy climax was, the E-mini will probably be unable to go much above the old high for possibly the rest of the decade.
Last week was a big bull bar in a big three-week rally. Traders expect at least slightly higher prices next week. The 20-week exponential moving average is a magnet above.
But traders know that legs in trading ranges typically stall once they reach the middle third of the range. Consequently, they expect at least a few sideways weeks to begin within the next couple of weeks.
After that, at test down to the bottom of the range around the December 2018 low or the March low is more likely than a continuation up to the prior all-time high.
The E-mini futures has rallied strongly for three weeks. By going above 2706, it is no longer 20% below the high. Consequently, it is no longer in a bear market (see daily chart).
Furthermore, it is now more than 20% above the low. Many traders therefore believe the E-mini is back in a bull market.
But Big Down, Big Up, creates Big Confusion. Confusion is one of the hallmarks of a trading range. Traders should expect a bear leg in the developing trading range to begin soon.
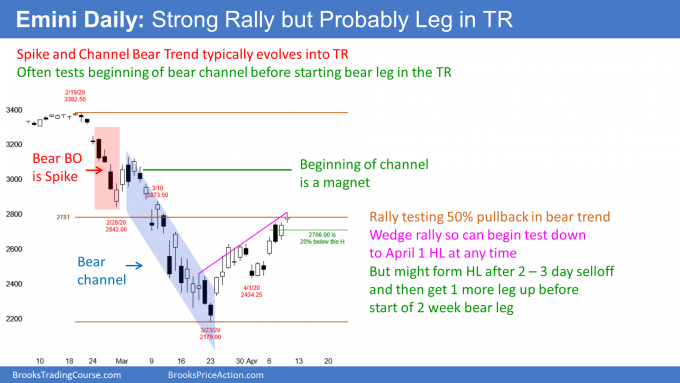
This week went above the 50% retracement level of the two-month bear trend. The bulls hope that the V bottom reversal continues up to the March 3 high. That was the start of the parabolic bear channel. But given how far above the low that is, there will probably be a two-week pullback first.
While there is not a clear wedge yet, the rally is beginning to develop wedge characteristics. That is an early sign that the bulls are getting hesitant and the bears are starting to short.
Spike & Channel Bear Trend
Traders know that a reversal up from a Spike and Channel Bear Trend usually eventually tests the start of the bear channel. Then, the rally typically evolves into a trading range.
That target is probably too far to reach with this V bottom, given how strong the selloff was. Therefore, traders should expect a test down to the April 1 higher low or March 23 bear trend low first. At that point, the bulls will try again.
There is no top yet so the rally might continue for another week or two. However, the bulls will probably start taking profits and the bears will begin to sell now that the rally has retraced half of the bear trend.
How far up will the V bottom rally go?
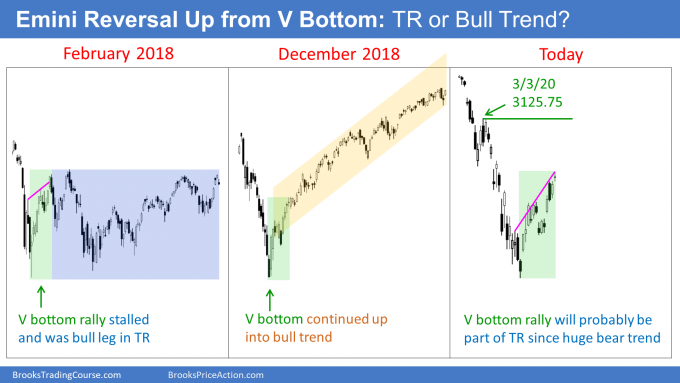
There have been three strong selloffs over the past 26 months. In February 2018, there was a 10% selloff and then a strong rally. It was a wedge rally and it became a bull leg in what grew into a six-month trading range.
The 20% collapse at the end of 2018 also led to a V bottom reversal. The rally grew into a bull trend. It lasted the entire year and the E-mini made a new high.
What will happen this time? The rally has been strong, like the other two times. Also, the start of the parabolic wedge bear channel was the March 3 high. That is a magnet after a sell climax. Many bulls expect the rally to get there before there is more than a three-day pullback.
make a V bottom reversal unlikely to grow into a bull trend. The bulls currently have only a 30% chance of a new high within the next two years.
Trading range more likely than bull trend
Currently, there is a 70% chance of a test of the March low or the April 1 higher low before there is a new high. But when will that test down begin? There is a developing wedge shape to the rally. That often leads to a couple legs down. Traders still want a clearer top, especially since the three-week bull channel is tight. This is a strong rally.
The parabolic bear channel began with the March 3 lower high. Traders know that a rally up from a Spike and Channel Bear Trend usually reaches to around the beginning of the bear channel. Even if it does, it will probably test down first.
Late in the March collapse, I said several times that there would be an extremely strong rally. It would be the start a V bottom reversal. But I said V bottoms reverse into bull trends only 20% of the time. They do so less often after crashes.
That is why I wrote that the V bottom rally would fail after a couple months and end up as a bull leg in what would become a trading range. This is similar to what happened in February 2018.
The three-week rally is behaving the way I thought it would. I still expect the reversal up from the V bottom to fail. Traders should expect the E-mini to enter a trading range, probably for the rest of the year. However, there is no top yet. The E-mini will probably be sideways to up for at least another week or two.
Trading Room
Traders can see the end of the day bar-by-bar price action report by signing up for free at BrooksPriceAction.com. I talk about the detailed E-mini price action real-time throughout the day in the BrooksPriceAction.com trading room. We offer a two-day free trial.


