
The rebound in the E-mini is approaching important technical levels, reports Al Brooks.
The E-mini S&P 500 futures has rallied strongly for four weeks. The bulls are trying to reach the February close to erase the entire March selloff. The rally has a wedge shape, which means it is a buy climax. But traders will buy the first two- to four-week pullback.
The April bar in the monthly E-mini S&P 500 chart so far is a big bull (see chart below). Its low is above the March low and its high is below the March high. April is therefore an inside bar.
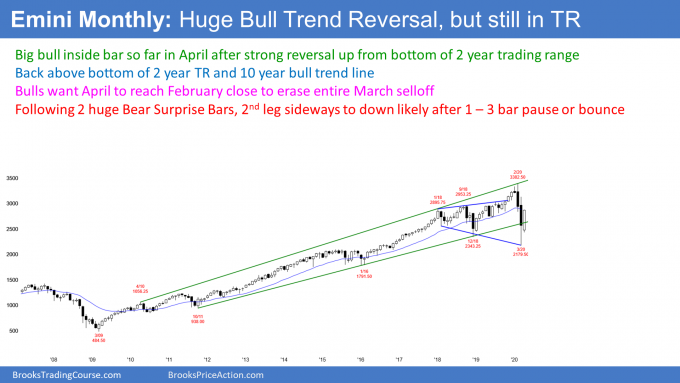
It is important to note that March collapsed below the 10-year bull trend line and the two-year trading range. It then reversed up dramatically. April is continuing that reversal up.
This is similar to what happened in January 2019. That, too, was a big bull inside bar following a collapse below a one-year trading range. It was a buy signal bar and the start of a yearlong rally to a new all-time high.
The importance of the February close
The bulls want April to get back above the February close. It will then have erased the March sell climax. Furthermore, it will be a sign of strong bulls. Traders will conclude that the low is in, even if the E-mini is sideways for the rest of the year.
We do not know yet if April will close on its high. If it has a prominent tail on top of its candlestick, traders will suspect that the bulls are slightly hesitant. That would reduce the chance of the rally continuing directly up to the old high.
The bulls are hoping that 2020 will be a repeat of 2019. But it will not be. It will probably be more like the rally in early 2018. While it was strong, it ended up as the first leg up in a six-month trading range.
Why is this different from last year?
What are the differences that account for this conclusion? There are several. An obvious one is that the E-mini fell 34% in two months. This is the most dramatic selloff since the Great Depression. That much selling makes a trading range for the next year more likely than a bull trend.
There are many trapped bulls who bought near the high who are desperate to exit if the rally gets near their entry price. Also, after such a strong selloff, the bears are eager to sell this rally. They know that the odds favor a test down within the next couple months.
In addition, the monthly chart had two consecutive big bear bars this time. That is more relentless selling than in late 2018. There was a bull bar in between the two big bear bars back then. That hesitation was a sign that the bears were not as determined as they could be. The bulls had less resistance in their reversal up.
History suggests trading range likely
Traders must pay attention to history. What has the market done when it has sold off 30% in the past?
The low of the March selloff was 34% down from the high. Once a selloff falls 20%, there is a bear market. The final low typically is around 30% down from the high. This selloff has already met that objective. But the final low on average comes a year after the high. Therefore, there is a risk of a new low a year from now.
V bottoms usually do not lead to bull trends
A reversal up from a sell climax is typically very strong. Traders refer to it as a V bottom.
But it is important to understand that a V bottom only has a 20% chance of growing into a bull trend. The first leg up is typically minor, even if it is very strong. A minor reversal up in a bear trend is either a bear flag or a bull leg in what will become a trading range.
If there is a reversal back down, traders will then watch for a second reversal up. That would then be a major trend reversal, which means it has a better chance of starting a bull trend. However, a major reversal still has only a 40% chance of growing into a bull trend. More often, it leads to a continuation of the trading range.
The E-mini S&P 500 E-mini has rallied 30% over the past four weeks. That is incredibly strong. It is now testing the 20-week exponential moving average (see weekly chart below).
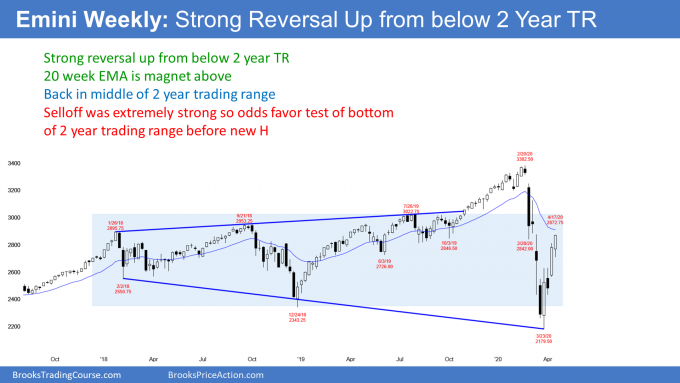
After a 34% selloff, traders expect that this first leg up will be minor. In terms of the percentage gained, it has been major. But when traders talk about major and minor trend reversals, this one is likely to be minor. That means another leg in the two-year trading range is more likely than a resumption of the 11-year bull trend.
A bull leg in a trading range eventually transitions into a bear leg. Traders expect the bear leg to begin within the next few weeks.
Only minor reversal down
The rally erased a lot of the damage from the two-month crash. But the bulls will probably have a difficult time extending the current leg up much beyond April. This is because the bulls who bought well (near the March low) know the rally will pull back soon. They will want to take profits before there is much of a reversal down.
Then there are the bulls who bought poorly (near the February high). They will begin to sell out of their longs, relieved to have avoided a huge loss.
Some of the rally is caused by bears who sold poorly (near the March low) and are being squeezed out of painful, losing positions. Once the remaining shorts have exited, there will probably not be many traders left to buy at the high. Also, strong bears will begin to scale into shorts now that the rally has reached the 20-week exponential moving average.
The increasing selling by both the bulls and the bears should soon overwhelm the buying by any traders left who are buying up here. The result will be a reversal back down.
After a strong rally like this, the minimum objective is a two-week pullback. Another is a 50% retracement of the four-week rally. At that point, traders will watch to see if the selloff is stalling and forming another higher low. If so, they will expect a test of the top of the current rally.
The E-mini has rallied strongly in a Small Pullback Bull Trend for four weeks (see daily chart below). It has retraced more than 50% of the two-month bear trend. That is a common resistance level. It is now testing the 50-day moving average and the 20-week exponential moving average.
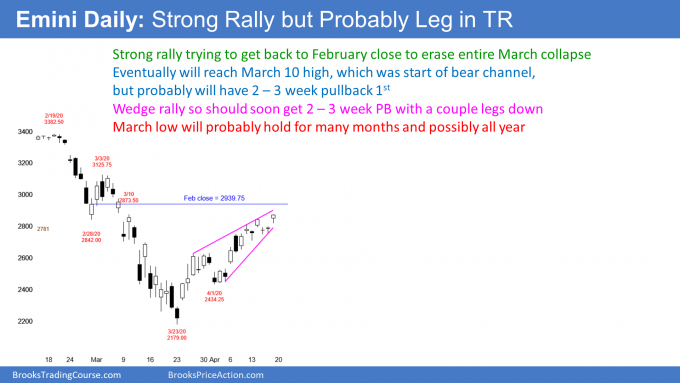
Most importantly, the bulls are trying to get back to the February close. If they succeed, they will have completely erased the March collapse.
How much higher before there is a pullback?
The rally has had three legs up. It is therefore a wedge. A wedge rally usually begins to attract sellers. The bulls see it as a buy climax and they start to take profits. Also, the bears expect the profit-taking to lead to lower prices. They therefore begin to scale into shorts.
Like most wedges, this one does not have a perfect shape or a strong sell signal bar. Because the bull channel is tight, many bulls see the trend as strong. They therefore are continuing to buy. They are trying to reach the February close before taking profits.
The rally also might reach the March 3 lower high. That was the start of the parabolic wedge bear channel. It is a reliable magnet. The bulls will probably get there at some point in 2020. But it might be too far up to reach before there is a two- to three-week pullback.
Because this rally has been extremely strong, the bulls will buy the first pullback. That is true even if it falls all of the way to the April low. More likely, it will probably not fall much below a 50% retracement of the rally.
Support and resistance are magnets
There are three remaining magnets above. The obvious one is the all-time high. That may be out of reach for 2020.
The nearest one is the February close, which is near the 20-week exponential moving average (on the weekly chart). That E-mini should get there, maybe even next week.
Next is the March 3 lower high. That was the start of the parabolic wedge sell climax. The start of a bear channel typically eventually gets tested when a sell climax reverses up. But it might be too far above the bear trend low. There may be one or more two- to four-week pullbacks before the E-mini can reach it.
The E-mini is currently testing the resistance of the 50-day simple moving average and the March 10 lower high. Institutional traders watch 50-, 100-, 150- and 200-day simple moving averages. These averages therefore are often support or resistance. Traders will watch next week to see if the bears are able to create a reversal down.
What to expect when there is a reversal down
When a wedge rally reverses, it usually does so at resistance. If the E-mini does reverse, traders will look for a couple legs down to support over the following two to four weeks.
One downside target is 2706. That is 20% down from the high. If the E-mini falls below that level, it will be back in a bear market.
Below that is the March 31 high. That is the breakout point for the second leg up. That should get tested during the pullback.
Less likely is the April 1 higher low. While the E-mini will probably get there this year, it is now so far above that price to make it is unlikely to fall that far within the next couple months.
Traders should expect sideways to up trading for another week or two. Then, the E-mini will probably pull back for a few weeks. After this strong of a rally, traders will buy the pullback.
Trading Room
Traders can see the end of the day bar-by-bar price action report by signing up for free at BrooksPriceAction.com. I talk about the detailed E-mini price action real-time throughout the day in the BrooksPriceAction.com trading room. We offer a two-day free trial.


