
Here is a look at potentially explosive chart pattern shorts in Chinese stocks from Suri Duddella.
As the fears of the Coronavirus and US-China trade war's impact eased, some China stocks have seen a performance boost in the first half of 2020. Few stocks have performed significantly well as they form Parabolic Arc patterns. These parabolic arc patterns may present opportunities as they start to correct.
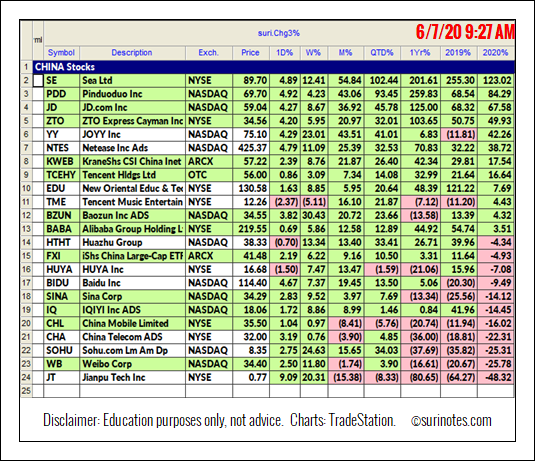
Chinese Stocks 2020
Below is a table listing the performance of major Chinese stock in 2020.
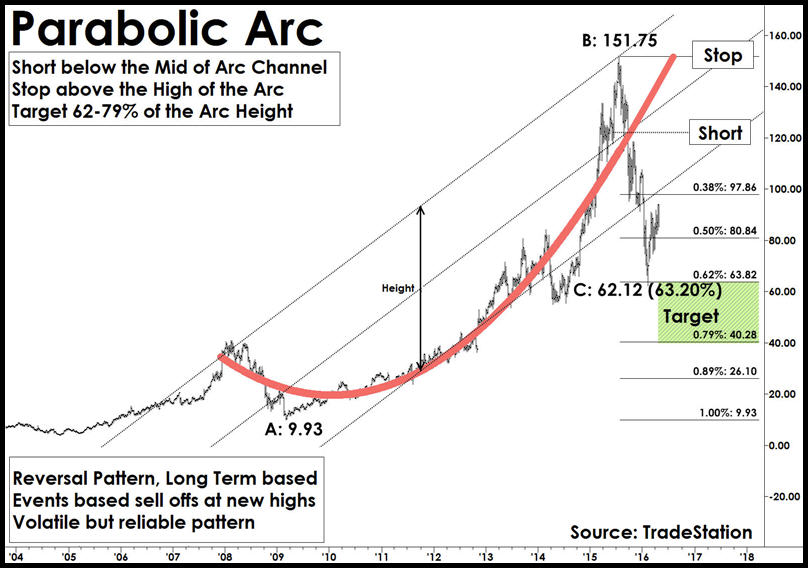
Parabolic Arc Patterns
Parabolic Arc chart patterns form when a steep rise in prices caused by irrational buying and intense speculation. Parabolic Arc patterns are rare, but they are reliable and are generated in mega bull trends. These patterns trend gradually making higher highs and lower lows in the beginning stages but can be volatile in the exhaustion and reversal stages. Irrational buying in public generates a strong rally to push prices vertically, followed by a steep sell-off. Examples of these market types are the NASDAQ bullish markets during 1990-2000 (retraced 80%) and gold prices from 2000-2011 (retraced 62%).
Parabolic Arc is a reversal pattern and has a very predictable outcome. Although these patterns are predictable, they are relatively difficult to trade since the market sentiment is bullish and may be fairly tough to point reversals to trade. Most Parabolic Arc patterns have a significant correction of 62-79% of its price rise (from the top).
Once Parabolic Arc patterns reach their targets of 62% and 79%, they tend to reverse as an oversold bounce. Usually these bounces are between 25% to 50% of its prior fall range from the peak (see chart).
Trading Parabolic Arcs
Trade: In Parabolic Arc patterns, prices move up vertically and eventually, the acceleration comes to a stop and then reverses. Prices start showing lower-lows and may attempt to regain the top again. Draw a channel connecting the top and bottom of the pattern. Enter a “short” trade at the breakdown of the channel trend line connecting the pattern high and pattern lows.
Target: Measure the distance of the rise from the base to the top of the pattern. Most Parabolic Arc patterns return to the 62% to 79% of its rise; 50% is the first target.
Stop: Protect the trade by placing a stop-loss a few ticks above the high of the Parabolic Arc.
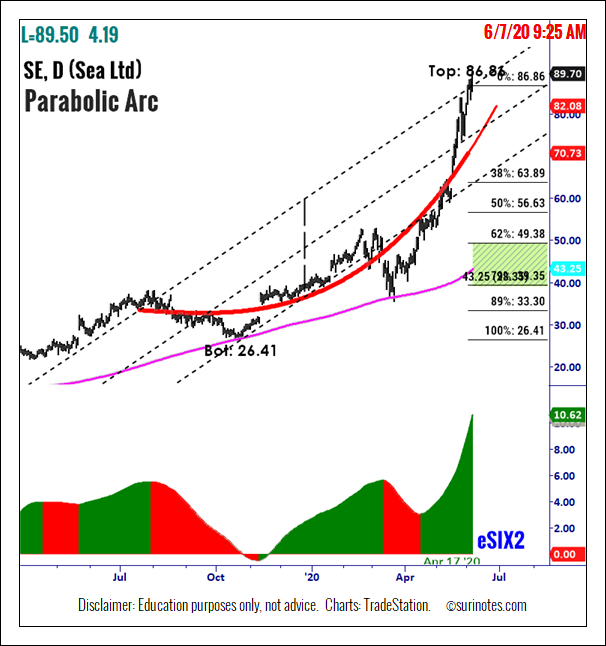
Sea Ltd. (SE) Parabolic Arc Pattern
Sea Limited (SE) has formed a Parabolic Arc pattern on its daily chart (see below). The pattern from a low of $26.41 in October 2019 to a high of $86.86 in June 2020. Parabolic Arc patterns are long-term patterns, but most of the upside parabolic patterns return to at least 50% to 62% of its prior rise in a correction mode. Currently, the pattern does not have a trade signal yet, but a short trade may be entered when the price starts to correct the trend channels confirming the underlying bearish trend. With the current Parabolic Arc high and low readings, the targets may be set near 50% to 62% of its parabolic arc range.
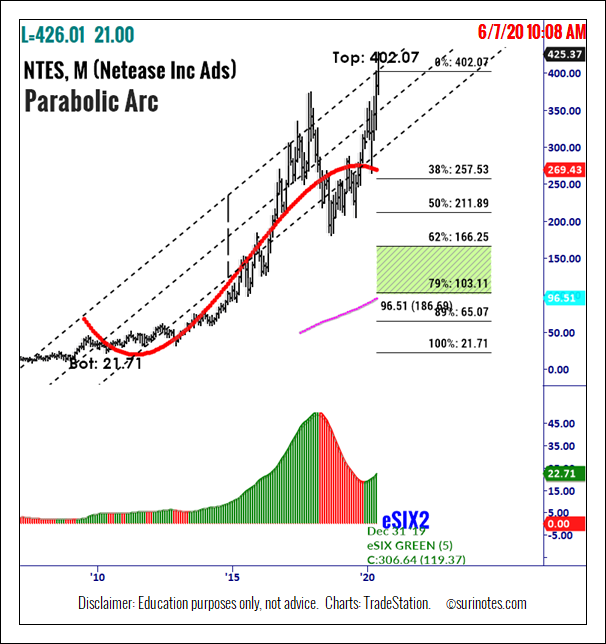
NetEase Inc. (NTES) Parabolic Arc Pattern
NetEase Inc. (NTES) formed a Parabolic Arc pattern formation in its monthly chart (see below). The pattern formed from a low of $21.71 in May 2010 to a high of $402.07 in June 2020. Currently, the pattern does not have a trade signal, but a short trade may be entered when the price starts to correct the trend channels confirming the underlying bearish trend. With the current Parabolic Arc high and low readings, the targets may be set near 50% to 62% of its parabolic arc range.
Watch Suri’s presentation “How to Trade Chart Patterns With Market Context,” Friday June 12 as part of the New MoneyShow Virtual Event. Find more of Suri’s work at surinotes.com.


