
All three major stock indexes are in megaphone patterns that may soon produce a trade signal, reports Suri Duddella.
All three major stock indexes (Dow Jones, S&P 500 and Nasdaq 100) have been trading within Megaphone patterns since 2018 and nearing their upper trendlines with positive momentum.
Megaphone patterns are considered both reversal and continuous patterns and usually appear at major tops and market bottoms. They were first described in Richard Schabacker’s 1932 book, "Technical Analysis and Stock Market Profits," as rare and intricate patterns. Megaphone patterns are also called Inverted Symmetric Triangle patterns or broadening patterns that usually develop after a strong up or down trend in the stock price.
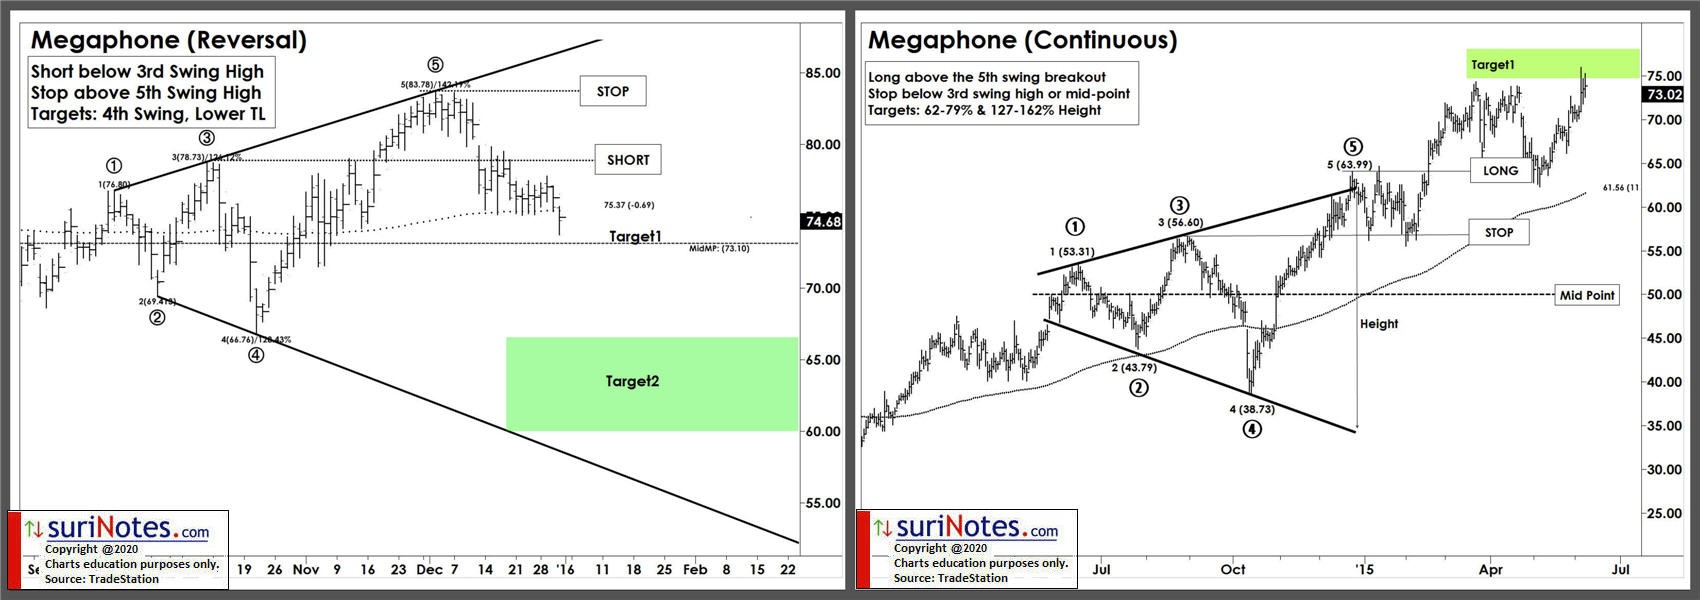
Megaphone pattern formations have five distinct swings. Each swing is larger than the previous swing, which gives the formation its Megaphone appearance. The key swing points in the Megaphone pattern are structured with lower low troughs and higher peaks and are connected by two diverging trendlines. Each of these swings may also include small minor swings. The key swings of the pattern are the first and the fifth swings, which show the reversal of major direction prior to the formation of the pattern. Another unique characteristic of Megaphone top/bottom pattern is that each swing’s increasing volatility triggers the reversals of upside and downside swings.
Trading Megaphone Patterns
Megaphone patterns present two trading opportunities: 1. Trading the breakout as a Megaphone continuous pattern, and 2, trading the reversal as a Megaphone reversal pattern.
Trades are placed after price reverses from 5th swing pivot level.
Trading the Breakout (Continuous)
To trade Megaphone a breakout pattern as a continuation of its up-trend, trades are taken in the direction of the breakout/breakdown from the pattern.
When a price bars close outside the pattern (above upper trendline) in the direction of the breakout/breakdown, a long trade is triggered.
Trading the Reversal
When price reaches the last and the 5th swing point and fail to continue higher (as a breakout), Megaphone pattern may be presenting an opportunity to short on its reversal. Once price starts to decline from the 5th swing point, wait for prices to close below the 3rd swing and enter a short trade.
Price Targets
The price target in a Megaphone breakout (continuous) pattern are computed using the Fibonacci ratio of the pattern height (vertical distance) added from the breakout levels. The price targets for the Megaphone reversal pattern are the midpoint of the pattern and the area between 4th swing and lower trend line. Historically, this would be the widest part of the pattern and is a very profitable target.
Stops
When trading Megaphone pattern breakouts, the third-swing high or low and the mid-channel point in the pattern are the critical points and trades should be protected with a stop at these levels. When trading the reversal, the stops should be placed outside the trend line (above the 5th swing point) to protect the trade (see charts below).
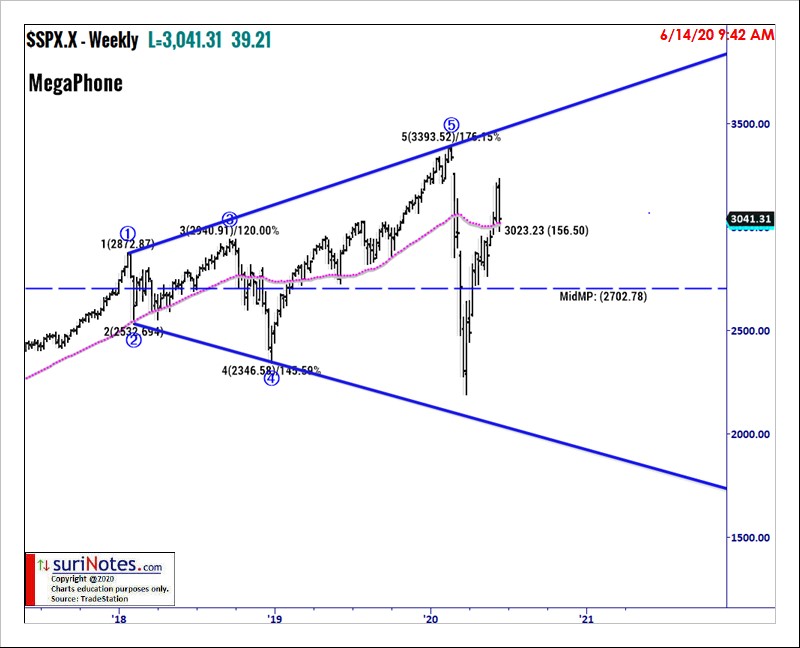
S&P 500 Index Megaphone Pattern
The S&P 500 is trading in a Megaphone pattern. Its weekly chart completed five swings and is currently trading above the mid Megaphone level (2702) and above 200-week moving average with positive momentum. The upper trendline targets are 3500 levels (see below).
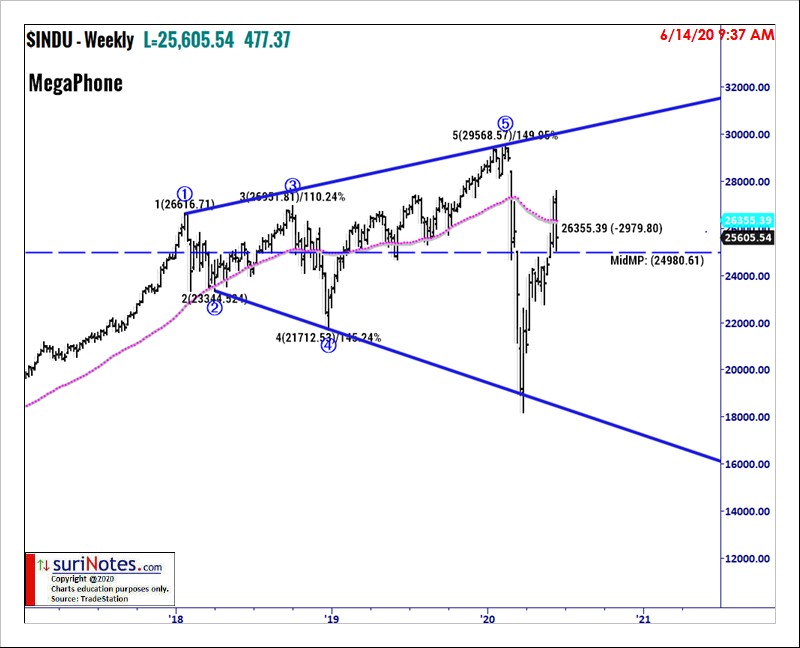
Dow Jones Index
The Dow Jones is also trading in a Megaphone pattern. Its weekly chart shows it completed five swings and is currently trading above the mid Megaphone level (26355) with positive momentum. The upper trendline targets are 30000 to 31000 (see below).
Nasdaq Composite Index
The following chart shows the current Nasdaq composite index weekly chart with a flat-base Megaphone pattern. It is currently trading near the upper tendline with positive momentum. The index could pause at these levels before picking a clear direction to trade above the upper trendline (see chart below).
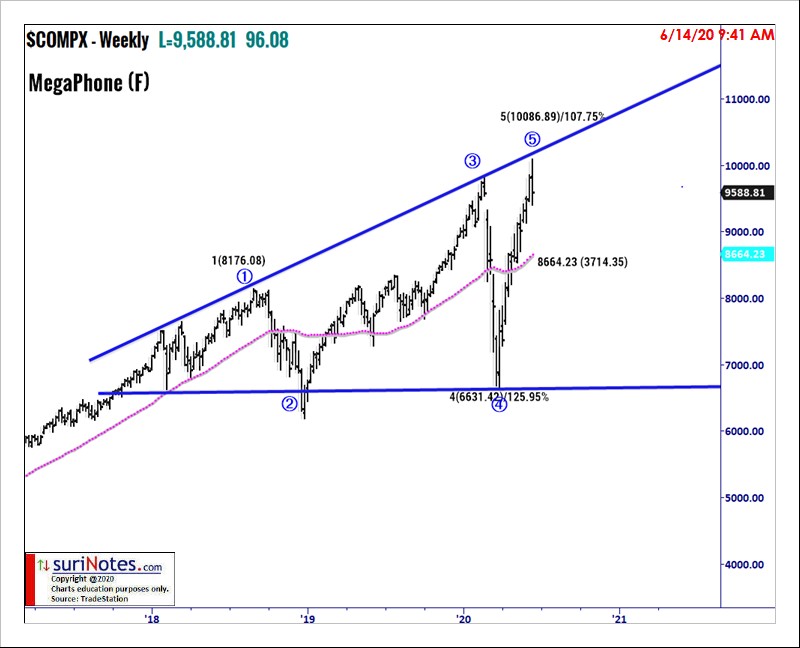
All three charts—the Nasdaq Composite, in particular—may provide a short signal as the failed breakouts are about to fall below the third wave peek.
Watch Suri’s presentation “How to Trade Chart Patterns With Market Context,” Friday June 12 as part of the New MoneyShow Virtual Event. Find more of Suri’s work at surinotes.com.


