
While technical clearly indicate that the 30-year T-bond is entering a bullish mode, new all-time high is unlikely to hit anytime soon, reports AL Brooks
U.S. 30-year Treasury Bond futures are stuck in a three-month tight trading range. After the huge reversal down from the extreme buy climax in March, the long bond has traded sideways to down for several months.
The 30-year Treasury bond reversed up two weeks ago. Last week was a High 2 bull flag buy signal bar.
Last week triggered the buy signal by moving above the previous week’s high (see chart below). But it only went one-tick above and then traded sideways. It a typical bull trap to make a new high by one tick and then reverse. Last week was a doji bar, which is neutral.
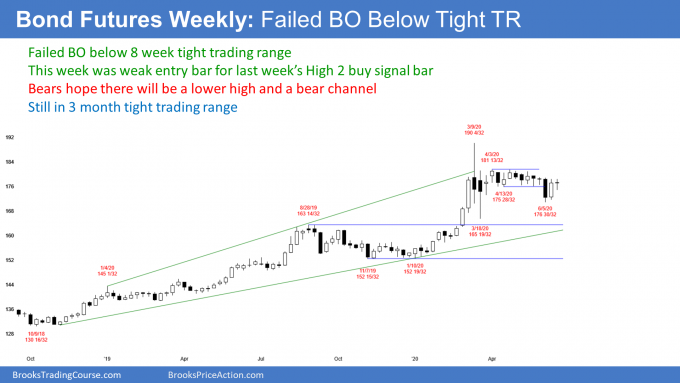
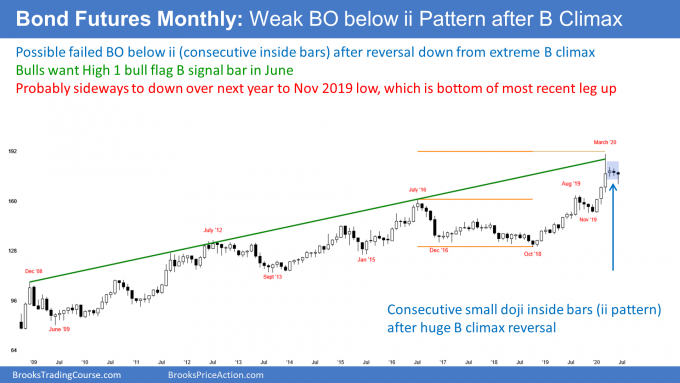
Furthermore, the 30-year bond futures are back in the middle of a two-month tight trading range, which is also neutral. Traders are deciding whether the bond futures will resume its 35-year bull trend or pull back more. The monthly chart is telling traders that any rally from here should be minor (see below).
Pullback from most extreme buy climax in history
The three-month rally that started the year was the most extreme buy climax in history on the monthly chart. There was a big reversal down in late March. Traders see that as a climactic reversal in a very overbought market.
Sometimes a big reversal like that will begin a bear trend. Usually, however, the trend ends, at least temporarily, and the market then goes sideways. That is what is happening here.
The exhausted bulls at some point will buy again. We do not yet know if they will buy at the current level or much lower.
When there is an extreme buy climax, traders expect the pullback to test the bottom of the lest leg up. That is the January low of 152 19-32.
A rally from here would be minor
If instead, a bull trend resumes, after just a three-month pullback on the monthly chart, traders do not believe it will reach the old high. Three bars are usually not enough time for exhausted bulls to buy again. They typically wait for about 10 bars and for two clear legs down.
Also, they want the reversal to reach major support, like the January low. Any rally before then usually forms a lower high.
Therefore, while this week triggered a weekly buy signal, there was very little buying. Traders expect a deeper selloff lasting about a year before the bulls will be willing to buy aggressively again. Since this is a monthly chart, traders expect about a year.
Consequently, any rally from here will probably form a lower high. Traders expect lower prices over the next year, even if there is a two- to three-month rally first.
Trading Room
Traders can see the end of the day bar-by-bar price action report by signing up for free at BrooksPriceAction.com. I talk about the detailed E-mini price action real-time throughout the day in the BrooksPriceAction.com trading room. We offer a two-day free trial.


