
Several semiconductor stocks are ready for major upside breakouts, reports Suri Duddella.
After the Coronavirus pandemic-influenced market sell-off, many Semiconductor stocks have seen a significant rise from the lows. Semiconductor stocks are currently trading in a Cup & Handle patterns. Cup & Handle patterns near the top of a trend are generally bullish, and once the patterns start to break out of the handles, they tend to provide bullish trading opportunities.
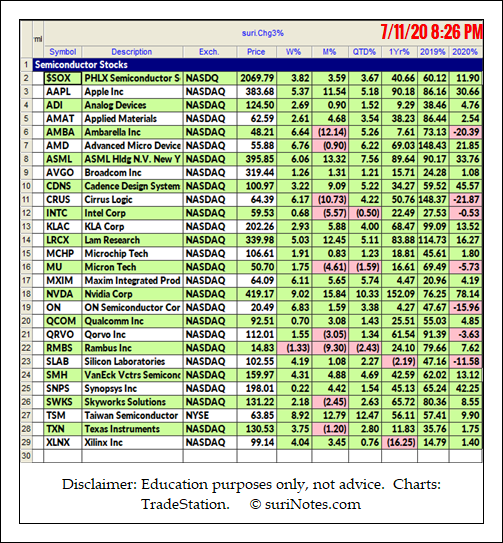
Here is a list of Semiconductor stocks and their 2020 performance:
Cup & Handle Patterns
The Cup and Handle Chart pattern was developed and popularized by William J. O’Neil in the 1980s through his CANSLIM methodology, Investor’s Business Daily articles and his book "How to Make Money in Stocks."
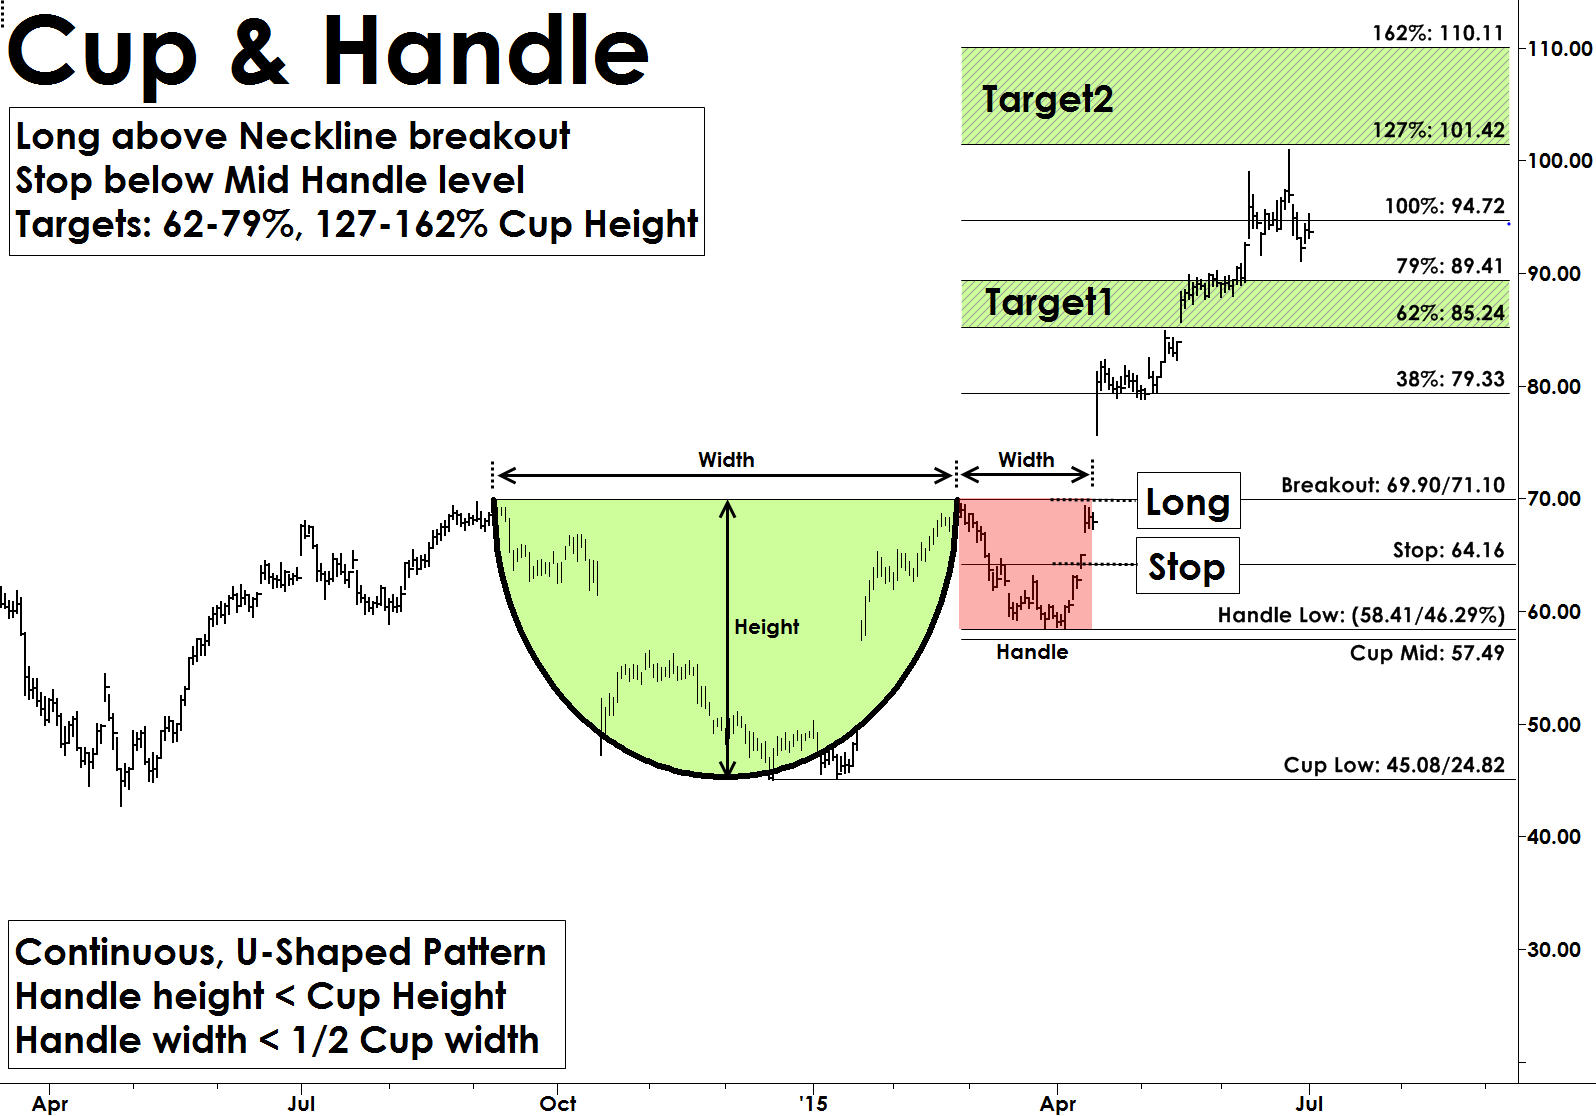
Cup and Handle pattern resembles a Cup with a Handle and are continuation patterns that usually form in bullish trends. Most Cup and Handle patterns are very reliable and offer great trading opportunities. They also form in all markets and in all time-frames. The “Cup” formation is developed as consolidation phase during price rallies from the round bottom formation over multiple weeks to months. The “Handle” part forms due to a price correction after “Cup” formation and before a clear breakout to the upside.
Cup and Handle pattern structure show the momentum pause after reaching a new high in a U-Shape form, followed by another attempt to breakout. When this breakout from the rim of the cup fails it starts to fall back to build the "Handle" structure. Usually, the handle structures are small, and the handle depth should not exceed more than 50% of cup depth. This handle part of the pattern generates interest in buyers as they expect the pattern to breakout from these levels. The pattern is valid only if price convincingly breaks out with increased volume above the rim of the cup levels (see chart below).
VanEck Vectors Semiconductor ETF
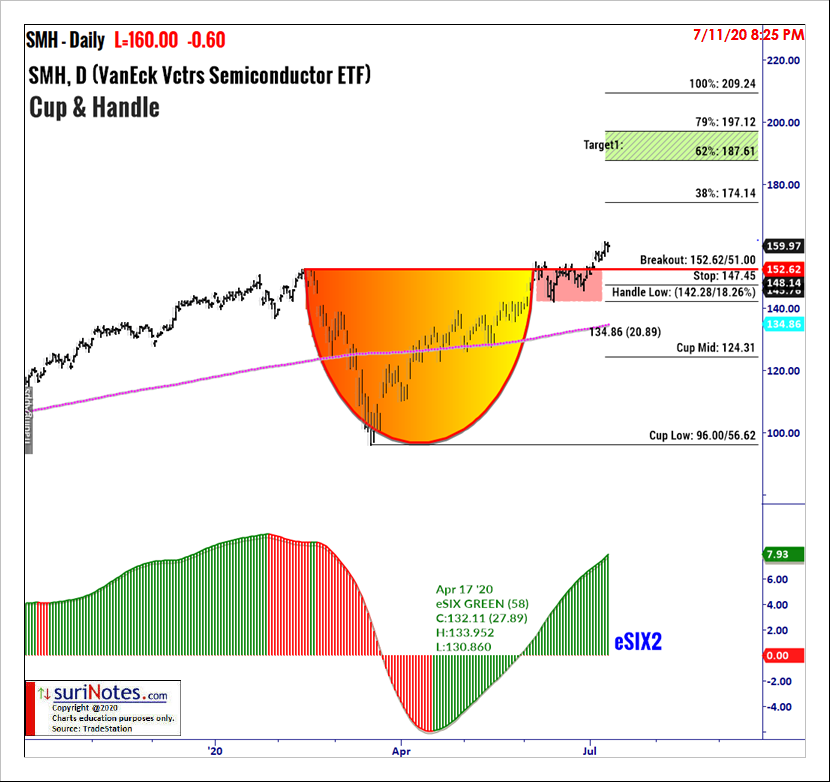
The VanEck Vectors Semiconductor ETF (SMH) is forming a Cup and Handle pattern on its daily chart and trading near the breakout level of $152.72 (see chart below). A breakout is signaled when price closes above the breakout level. The SMH Pattern's mid cup Level is $124.31, and handle low is $142.28. A stop is placed below the lowest low of the mid-cup or handle's low. Targets are placed at $174.14, 4187.60 and $197.10.
Qorvo Inc.
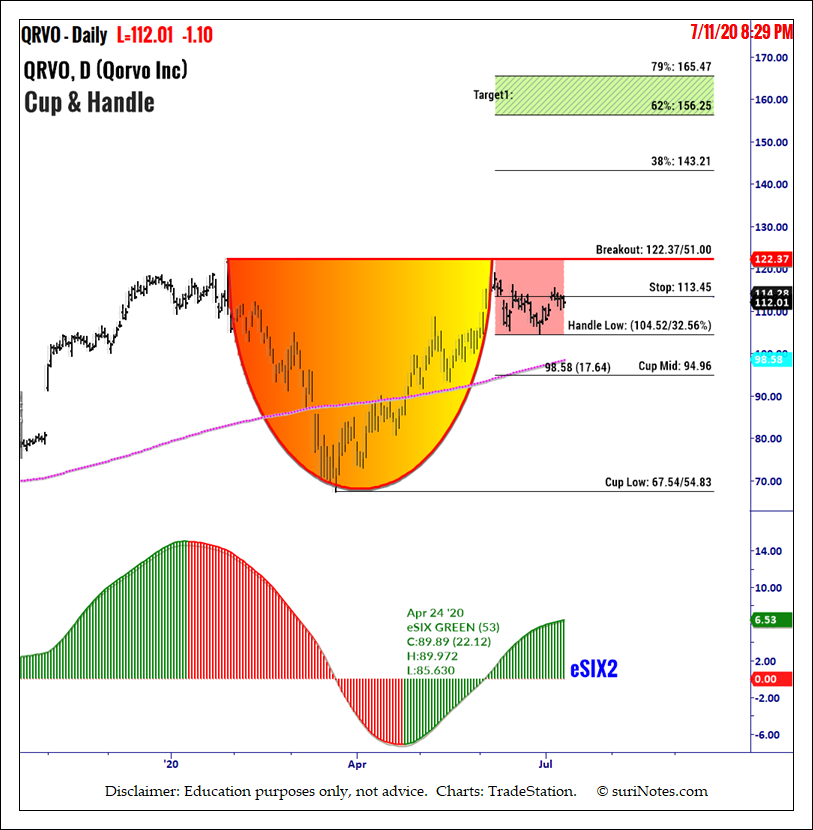
Qorvo Inc. (QRVO) is forming a Cup and Handle pattern on its daily chart and trading below the breakout level of $122.47 (see chart below). QRVO Pattern's mid cup Level is $94.96 and handle low is $104.52. A stop is placed below the lowest low of the mid cup or handle's low. Profit targets are $143.21, $156.30 and $165.50.
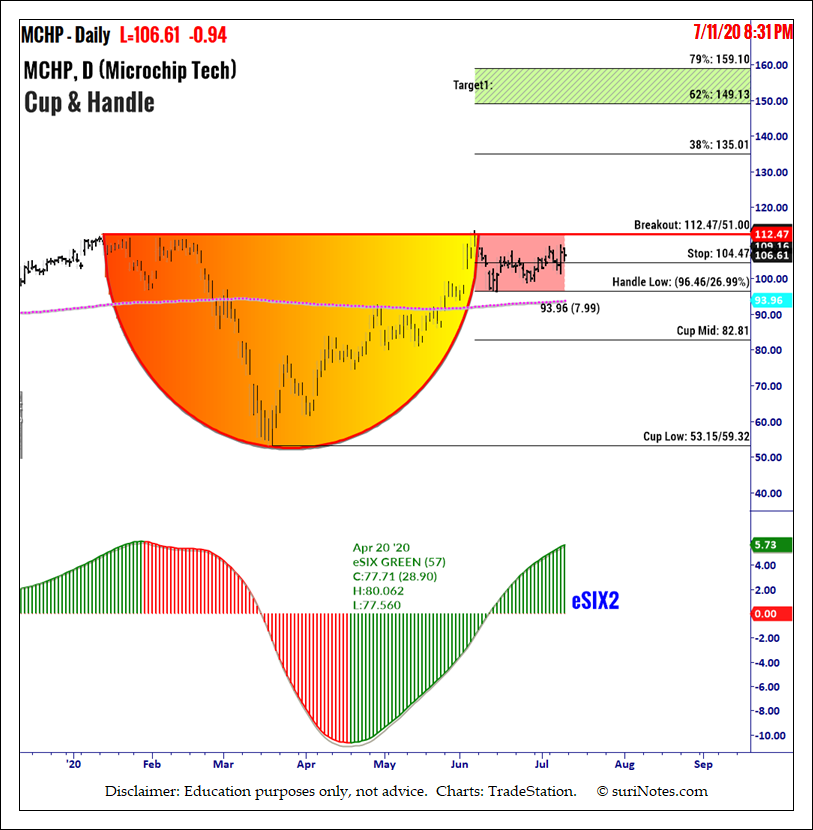
Microchip Technology
Microchip Technology (MCHP) daily chart is forming a C&H pattern and trading below the breakout level: 112.57. C&H patterns are valid only when price closes above the breakout level. MCHP Pattern's mid cup Level: 82.81, and handle low is 96.46. A stop is placed below the lowest low of the mid cup or handle's low. Targets are placed at 135.01, 149.1 to 159.1.
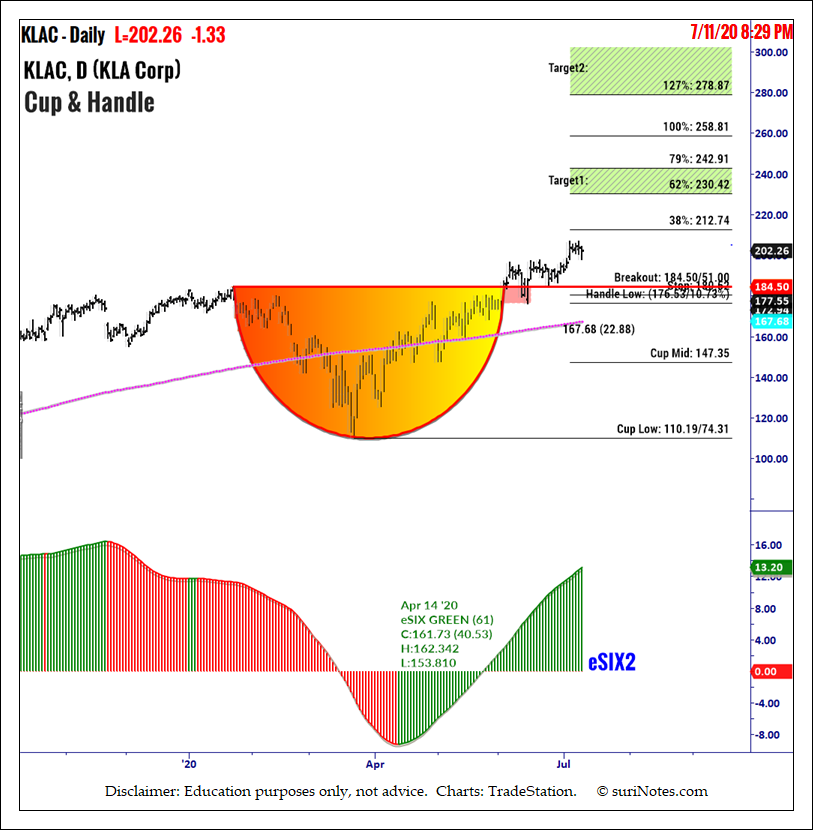
KLA Corporation
KLA Corporation (KLAC) formed a Cup and Handle pattern and on its daily chart and is trading above the breakout level of $184.60. KLAC Pattern's mid cup Level: 147.35. A stop is placed below the lowest low of the mid cup or handle's low. Targets are placed at $212.74, $230.40, $242.90 and $258.80.
Watch Suri’s archived presentation “How to Trade Chart Patterns With Market Context,” from Friday June 12 as part of the New MoneyShow Virtual Event. Find more of Suri’s work at surinotes.com.


