
The E-mini S&P filled the Feb. 24 gag and is ready to breakout, but in what direction asks, Al Brooks.
The E-mini S&P 500 has rallied for four months from its 10-year bull trend line. It has paused for a couple weeks in the February gap. Traders are deciding whether the rally will close the gap and continue to a new high or reverse down and retrace half of the rally. The probability is slightly better for the bulls.
The monthly E-mini S&P 500 futures chart had a huge reversal up from the 10-year bull trend line in March (see chart below). It has rallied strongly for since April, almost completely erasing the pandemic crash.
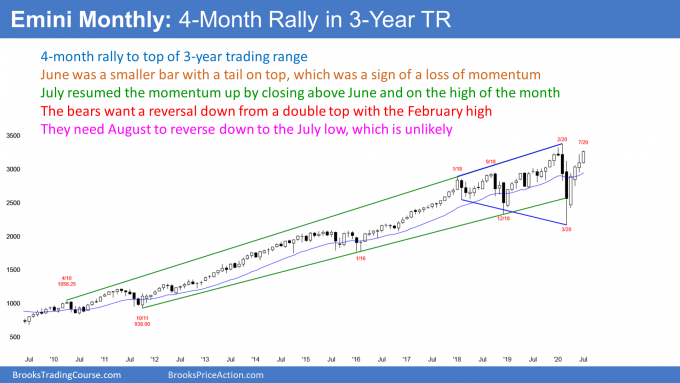
I mentioned in June that the candle bodies had been shrinking for three months. That was a sign that the rally was losing momentum as it approached the top of the three-year trading range. Also, June had a big tail on top. That is a sign of the bulls taking profits.
This combination made it likely that July would not get much above the June high. While that turned out to be true, July closed on its high and above the June high. This is a resumption of the momentum up.
That is a low probability outcome. When there is a bull surprise, there is usually at least some follow-through buying. This increases the chance of at least slightly higher prices in August.
Last week closed on its high, which is good for the bulls. It is a bull inside bar in a bull trend (see chart below). It is therefore a High 1 bull flag buy signal bar for this week. This increases the chance of at least slightly higher prices next week.
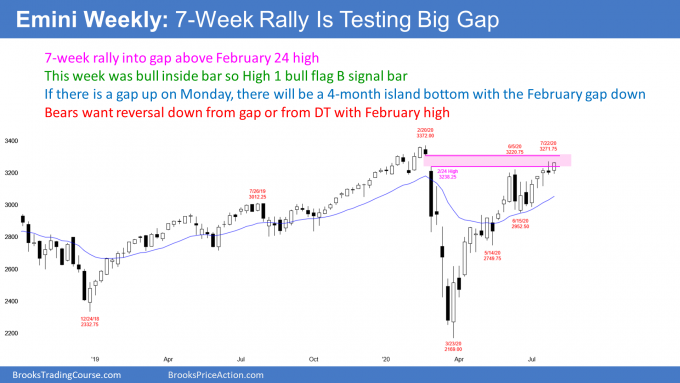
The bulls want the E-mini to trigger the buy signal this week by going above last week’s high. They then want the rally to close the February gap. Since the top of the gap is just below the all-time high, if they close the gap, we will probably get a new all-time high soon afterwards.
Possible four-month island bottom
Two of the past four weeks gapped up, but both gaps closed later in the day. With last week closing on its high, there is an increased chance of a gap up this week.
Since the E-mini gapped down four months ago, a gap up would create a four-month island bottom. If the gap is big, the odds of it staying open for at least a few weeks will go up. It would also increase the chance of a new all-time high within a few weeks.
Because the March crash was so severe, there are many traders shorting around the old high. A rally to a new high could create intense short covering. This could result in a surprisingly big breakout.
Persistent rally but some weakness
The weekly S&P500 E-mini futures chart has rallied in a Small Pullback Bull Trend since the March low. However, the fifth week up was a doji bar. Also, there have been several other dojis and bear bars since.
This is trading range price action. That increases the chance that the rally since that doji bar in April is only a bull leg in what will become a trading range.
There is no top yet and the momentum up at this point is strong enough so that traders think that a new high will come before there is pullback lasting more than a few days.
It is important to note that even though the week closed on its high, it did not go above last week’s high. Also, the three prior weeks had small bodies and big tails. Every tail is a reversal. These doji bars are a sign of balance and uncertainty. This gives the bears hope of a reversal down before there is a new high.
The E-mini in the weekly chart has paused for two weeks in the February gap. Traders do not yet know if there will be enough sellers here to get a one- to two-month reversal down to the middle of the three-year trading range. That is also the middle of the four-month rally. They should find out within a couple weeks. At this point, the odds slightly favor a new high before a pullback.
When will the bull trend end?
As I said, there is no top yet and the E-mini might rally to a new all-time high before there is a bear leg. However, a rally with lots of trading range price action typically evolves into a trading range.
A conversion into a trading range would require a selloff lasting at least a few weeks. If it were to begin around the old high, the first downside target would be the five-week trading range that ended in early July. That is a potential Final Bull Flag.
It is important to understand that the bear leg often falls all the way down to that first doji where the trading range price action began. That is the April 21 low just above 2700.
The daily E-mini chart has had many big days up and down in July (see below). It continues to oscillate in a tight range around the Feb. 24 high. That is the bottom of the gap down on the daily and weekly charts at the start of the pandemic crash.
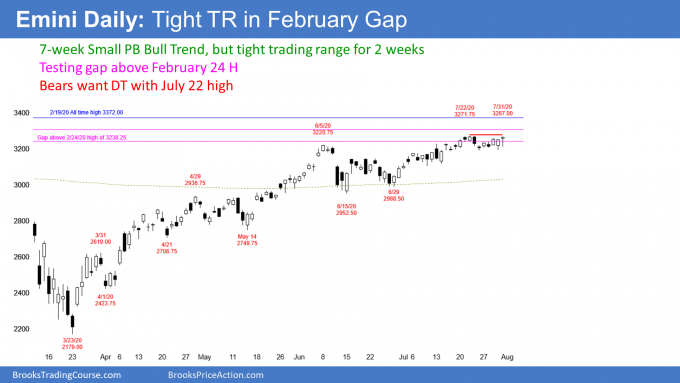
I have talked about that gap as an important magnet since it formed. Once the rally started to get near it in June, I said that traders would expect the E-mini to enter the gap. I said most bears would not want to sell unless the E-mini entered the gap and reversed down. It has entered the gap, but there has not yet been a credible top.
The E-mini is testing the February gap and the all-time high. This is a very important price level. The past three days had bull bodies and closed on its high. It is in a bull trend on the daily and weekly charts. On the monthly chart, July closed on its high and well above the June high. These factors make it more likely that the bulls will get their new all-time high in August before there is more than a three-day pullback.
Potential for surprisingly big breakout up or down
The E-mini is now back at the start of the Pandemic Crash. This is an emotional level.
Energy is building within the February gap. This increases the chance that one side or the other will get trapped. That can result in a very big breakout with sustained follow-through, and the move can be in either direction. We just don’t know at this point if the breakout will be up or down, and if the losing side will exit in a panic, creating a huge breakout.
The bulls got trapped by the crash in February and March. Many are afraid that there might be another selloff at this level. This could result in panic selling.
Yes, the bulls have momentum, but have you heard anyone say that people should sell here? This means that the longs are in a crowded trade. There might not be a lot of shorts to cover. We don’t know. But if the shorts won’t buy and the bulls are fully invested, who will buy at this price? This creates the potential for a big move down.
Also, there might be many bears selling here, betting on a double top. If so, they will get squeezed on a breakout to a new high. A short squeeze can lead to a big rally.
Downside targets
If there is a reversal down, it will probably retrace a third to a half of the four-month rally. Big round numbers are important. The most significant ones here are 3000, 2800 and 2700. The reason why 3000 is important is that it is a multiple of 1,000 and not just 100. There is a potential Final Bull Flag around 2800. Finally, 2700 is approximately a 50% pullback of the four-month rally.
Trading Room
Traders can see the end of the day bar-by-bar price action report by signing up for free at BrooksPriceAction.com. I talk about the detailed E-mini price action real-time throughout the day in the BrooksPriceAction.com trading room. We offer a two-day free trial.


