
The Current bull run in the S&P 500 is calling for a correction, writes Al Brooks.
The E-mini S&P 500 had a streak of nine consecutive bull bars that ended last week. Traders should expect a 10% correction to begin by the end of the month.
The E-mini S&P 500 futures has rallied strongly for five months from the March sell climax down to the 10-year bull trend line on the monthly chart (see below). While the E-mini broke above the February high, the breakout so far has been small.
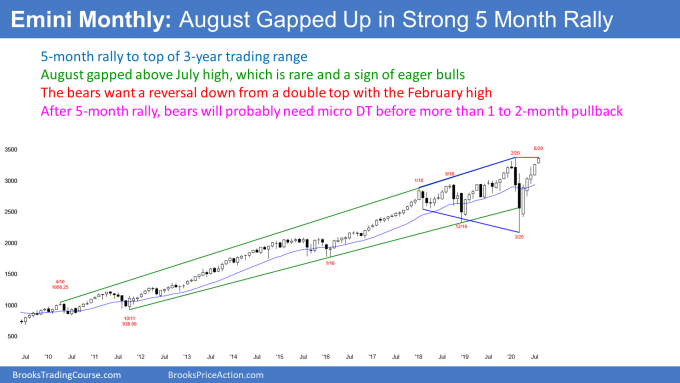
Also, there are two weeks left to the month and August could look very different once the bar closes. For example, the range is not big. Therefore, a two-week selloff could reverse down to below the open of the month. August would then be a bear reversal bar and a sell signal bar for a double top with the February high.
But even if that were to happen, the five-month rally was surprisingly strong. A Bull Surprise rally typically has at least a small second leg up. Consequently, traders will buy the first reversal down.
This is true even if it is big and fast. A strong bull trend like this usually cannot immediately reverse into a bear trend without at least forming a micro double top first.
To create a micro double top, there needs to be a one to two-bar selloff and then a rally back up to around the old high. In this case, if the selloff begins in August, the August high would be a magnet, two to four months from now.
How much higher can the bull trend go?
Can the five-bar (month) rally grow into a 10-bar rally? While possible, it is unlikely. Traders already see this rally as overdone.
The stops for the bulls are below the March low. Traders are therefore risking about 35%. Risk managers at trading firms will soon start to tell traders to take some profits to reduce that risk. Therefore, even if the rally goes a lot higher, there will probably be at least a one-month pullback starting within a couple months.
Wedge rally to possible double top
The E-mini futures gapped up on four of the past six weeks, so the bulls have been aggressive (see weekly chart below). However, only one of the gaps remained open, which is not what traders expect in a bull trend that will go much higher. Something is wrong. Also, this week barely broke to a new all-time high, but it closed below the February high.
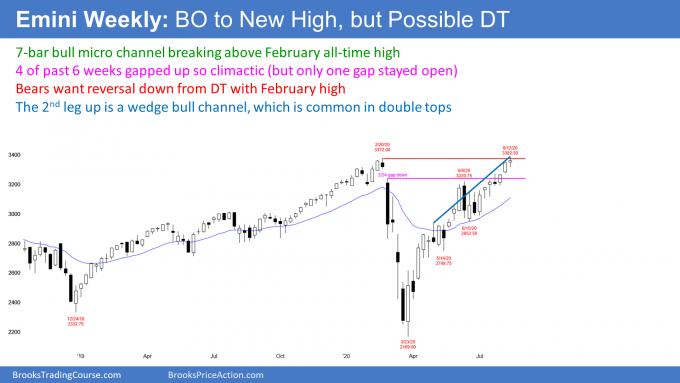
As strong as the five-month rally has been, this is the third leg up from the March low. This is therefore a wedge rally to a possible double top. That combination is a common reversal pattern. Also, the third leg up is a seven-bar bull micro channel, which is a buy climax. While there is no reversal yet and the E-mini could continue much high, the odds now favor a pullback beginning soon from this area.
In June, there was a tight trading range. It came late in a bull trend and it is therefore a candidate for a Final Bull Flag. If there is a reversal down from around the February high, traders will expect it to reach the bottom of that flag. That is around 3,000 and it would be about a 10% correction.
After 9 consecutive bull bars, pullback likely soon
The E-mini broke to a new all-time high this week (see daily chart below). But it was too strong. The rally had nine consecutive bull bars. Since that is rare, it is unsustainable and a buy climax.
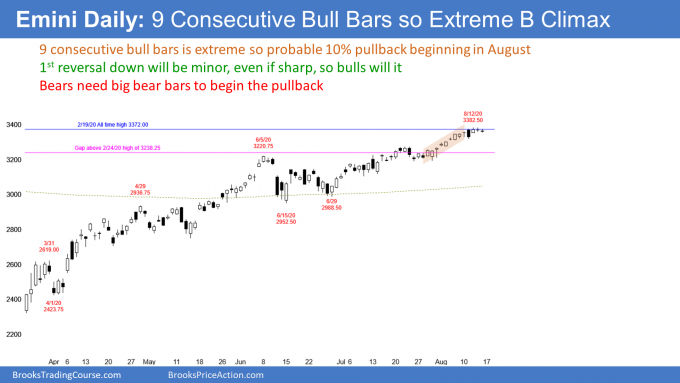
There were eight consecutive bull bars in June. Five days later, the E-mini was down 8%.
The next earlier time with eight consecutive bull bars was in January of 2018. That streak was nine bars, like the current one. That rally was the first leg up in a parabolic wedge buy climax. The top came nine days later and the E-mini sold off 10% over the next two weeks.
Traders should expect a similar pullback after this buy climax. Will there be a couple briefer legs up to a parabolic wedge top like in 2018? This rally does not look climactic enough for that. More likely, it will begin to turn down before the end of the month without going much higher. The bulls might want the cash index to make a new all-time high first.
On the cash chart, institutions look at the close. Last week poked above the February highest close a couple times but could not close above it. The bulls will likely try again this week. They will probably succeed, but traders should still expect a minor reversal to start before the end of the month.
A common target is the bottom of the most recent buy climax. That is the low of the first of the nine bull bars and it is around 3200. Below that is the June trading range at around 3000. Since that is about 10% down and that is comparable in size to the other streaks that I mentioned, the mini will probably get there before the end of September.
Trading Room
Traders can see the end of the day bar-by-bar price action report by signing up for free at BrooksPriceAction.com. I talk about the detailed E-mini price action real-time throughout the day in the BrooksPriceAction.com trading room. We offer a two-day free trial.


