
As most of the world's equity markets climb rapidly back to the pre-Covid levels, Asia's Emerging markets (China, Taiwan, Korea) have been outperforming other emerging markets, states Suri Duddella of suriNotes.com.
Market analysts think Asia's markets will continue to outperform in 2021 as they trade in V-bottom patterns.
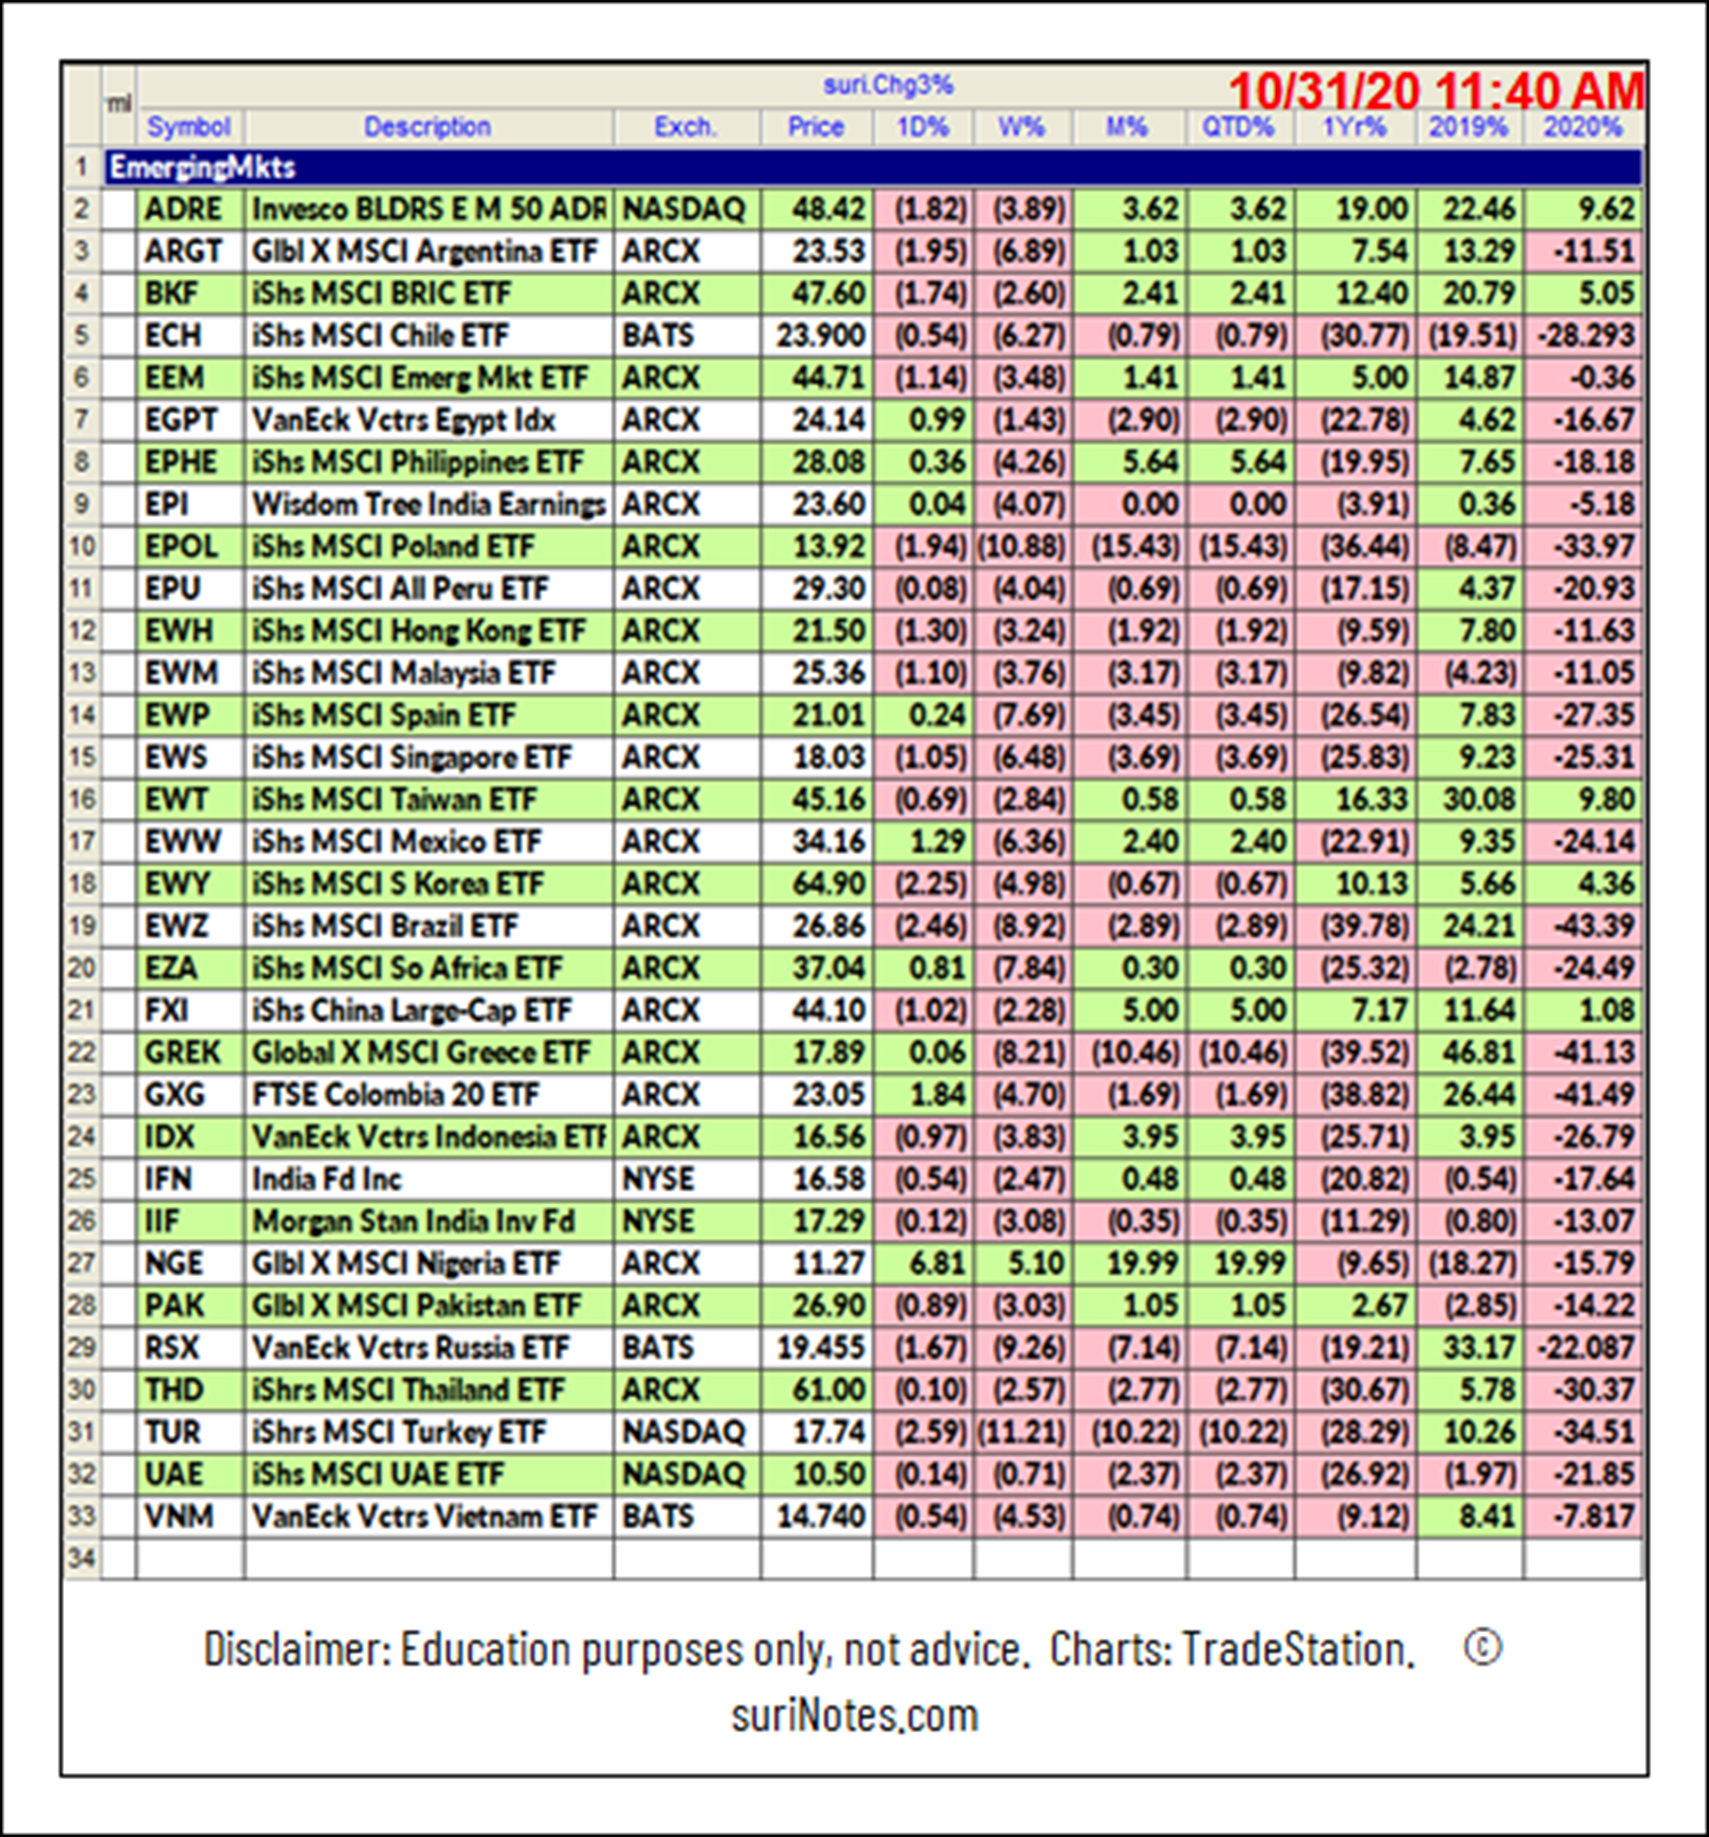
Here are Emerging Market ETFs and their 2020 performances.
V Patterns
As the name implies, the "V" chart patterns have the letter "V" shape and prices shift their momentum from an aggressive sell-off (Bearish) to aggressive rally (Bullish) in its structure. It is relatively a rare pattern with extreme angles and maybe not easy to recognize until it is mostly formed. The V-pattern is a powerful reversal pattern seen in all markets, all time frames, and in all instruments. The "V" pattern consists of rapid price action and may not be suitable for casual investors. The "V" patterns are formed when its trend is sharply switched from bearish to bullish (in case of V-bottom) or bullish (or sideways) to bearish (in case of V-top patterns).
Trading V Patterns
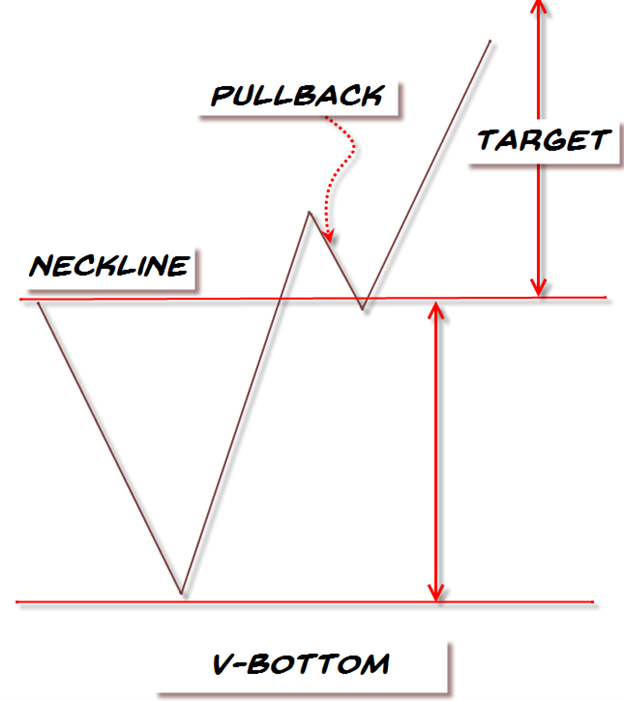
The critical aspect of the V pattern is it must have a sharp downtrend followed by a quick and sharp uptrend reversal. Look for 1-3 bar reversals at the bottom of the pattern to signify the sharp reversal process. The volume increases during both the phases of the breakdown (down-shift momentum) and breakout (up-shift momentum). There are a few ways to trade this pattern, but the most conservative way is to trade a long entry once the pattern is complete and retraces back to the neckline (as a pullback). Aggressive traders may enter on the trendline breakouts at the bottom, but the success rate with simple trendline breakouts is low (52%) compared to the neckline breakout (64%) reaching its 1st target range 62-79% of its size from breakout level.
The key factors of the pattern identification.
- Sharp downtrend
- Sharp uptrend
- V-shaped pattern (usually 1-3 bars reversals)
- Volume increase in both breakdown and breakout phases
- Breakout over neckline
- Pullback to the neckline
- Target
Here is a diagram of the "V" bottom pattern
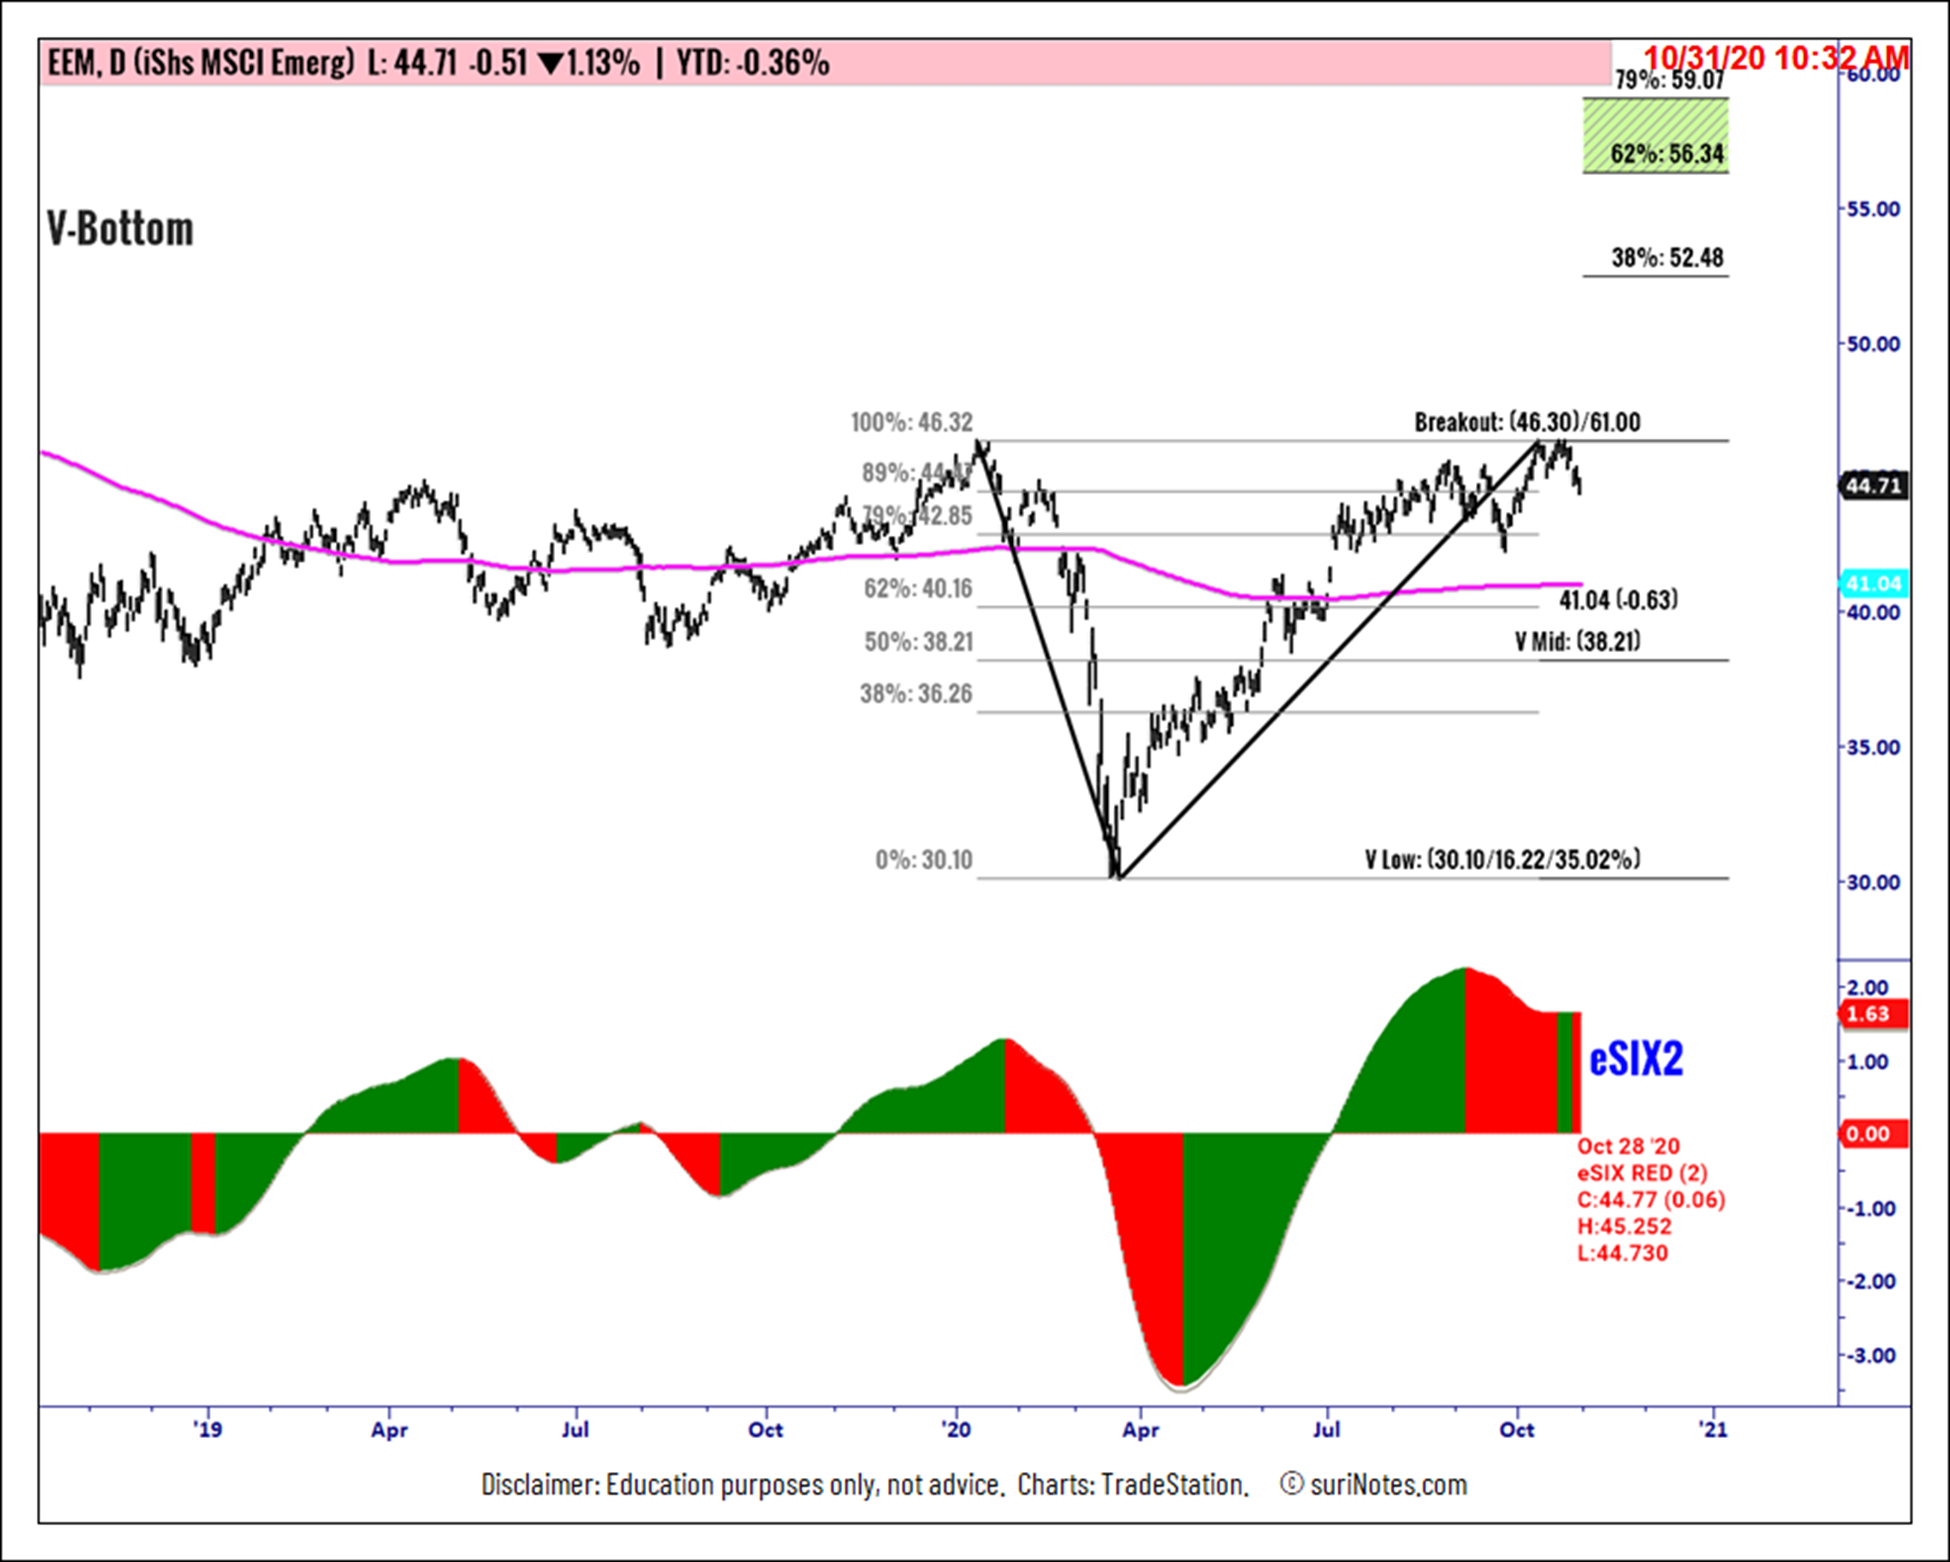
iShares MSCI Emerg Mkt ETF (EEM) is forming a V-bottom pattern on its daily chart and trading near the breakout level of $46.42. V-bottom patterns are traded when price closes above the breakout level. A stop is placed below the mid-level of the V-bottom pattern at $38.21 or the recent pivot low. Targets are placed at $56.30 to $59.10.
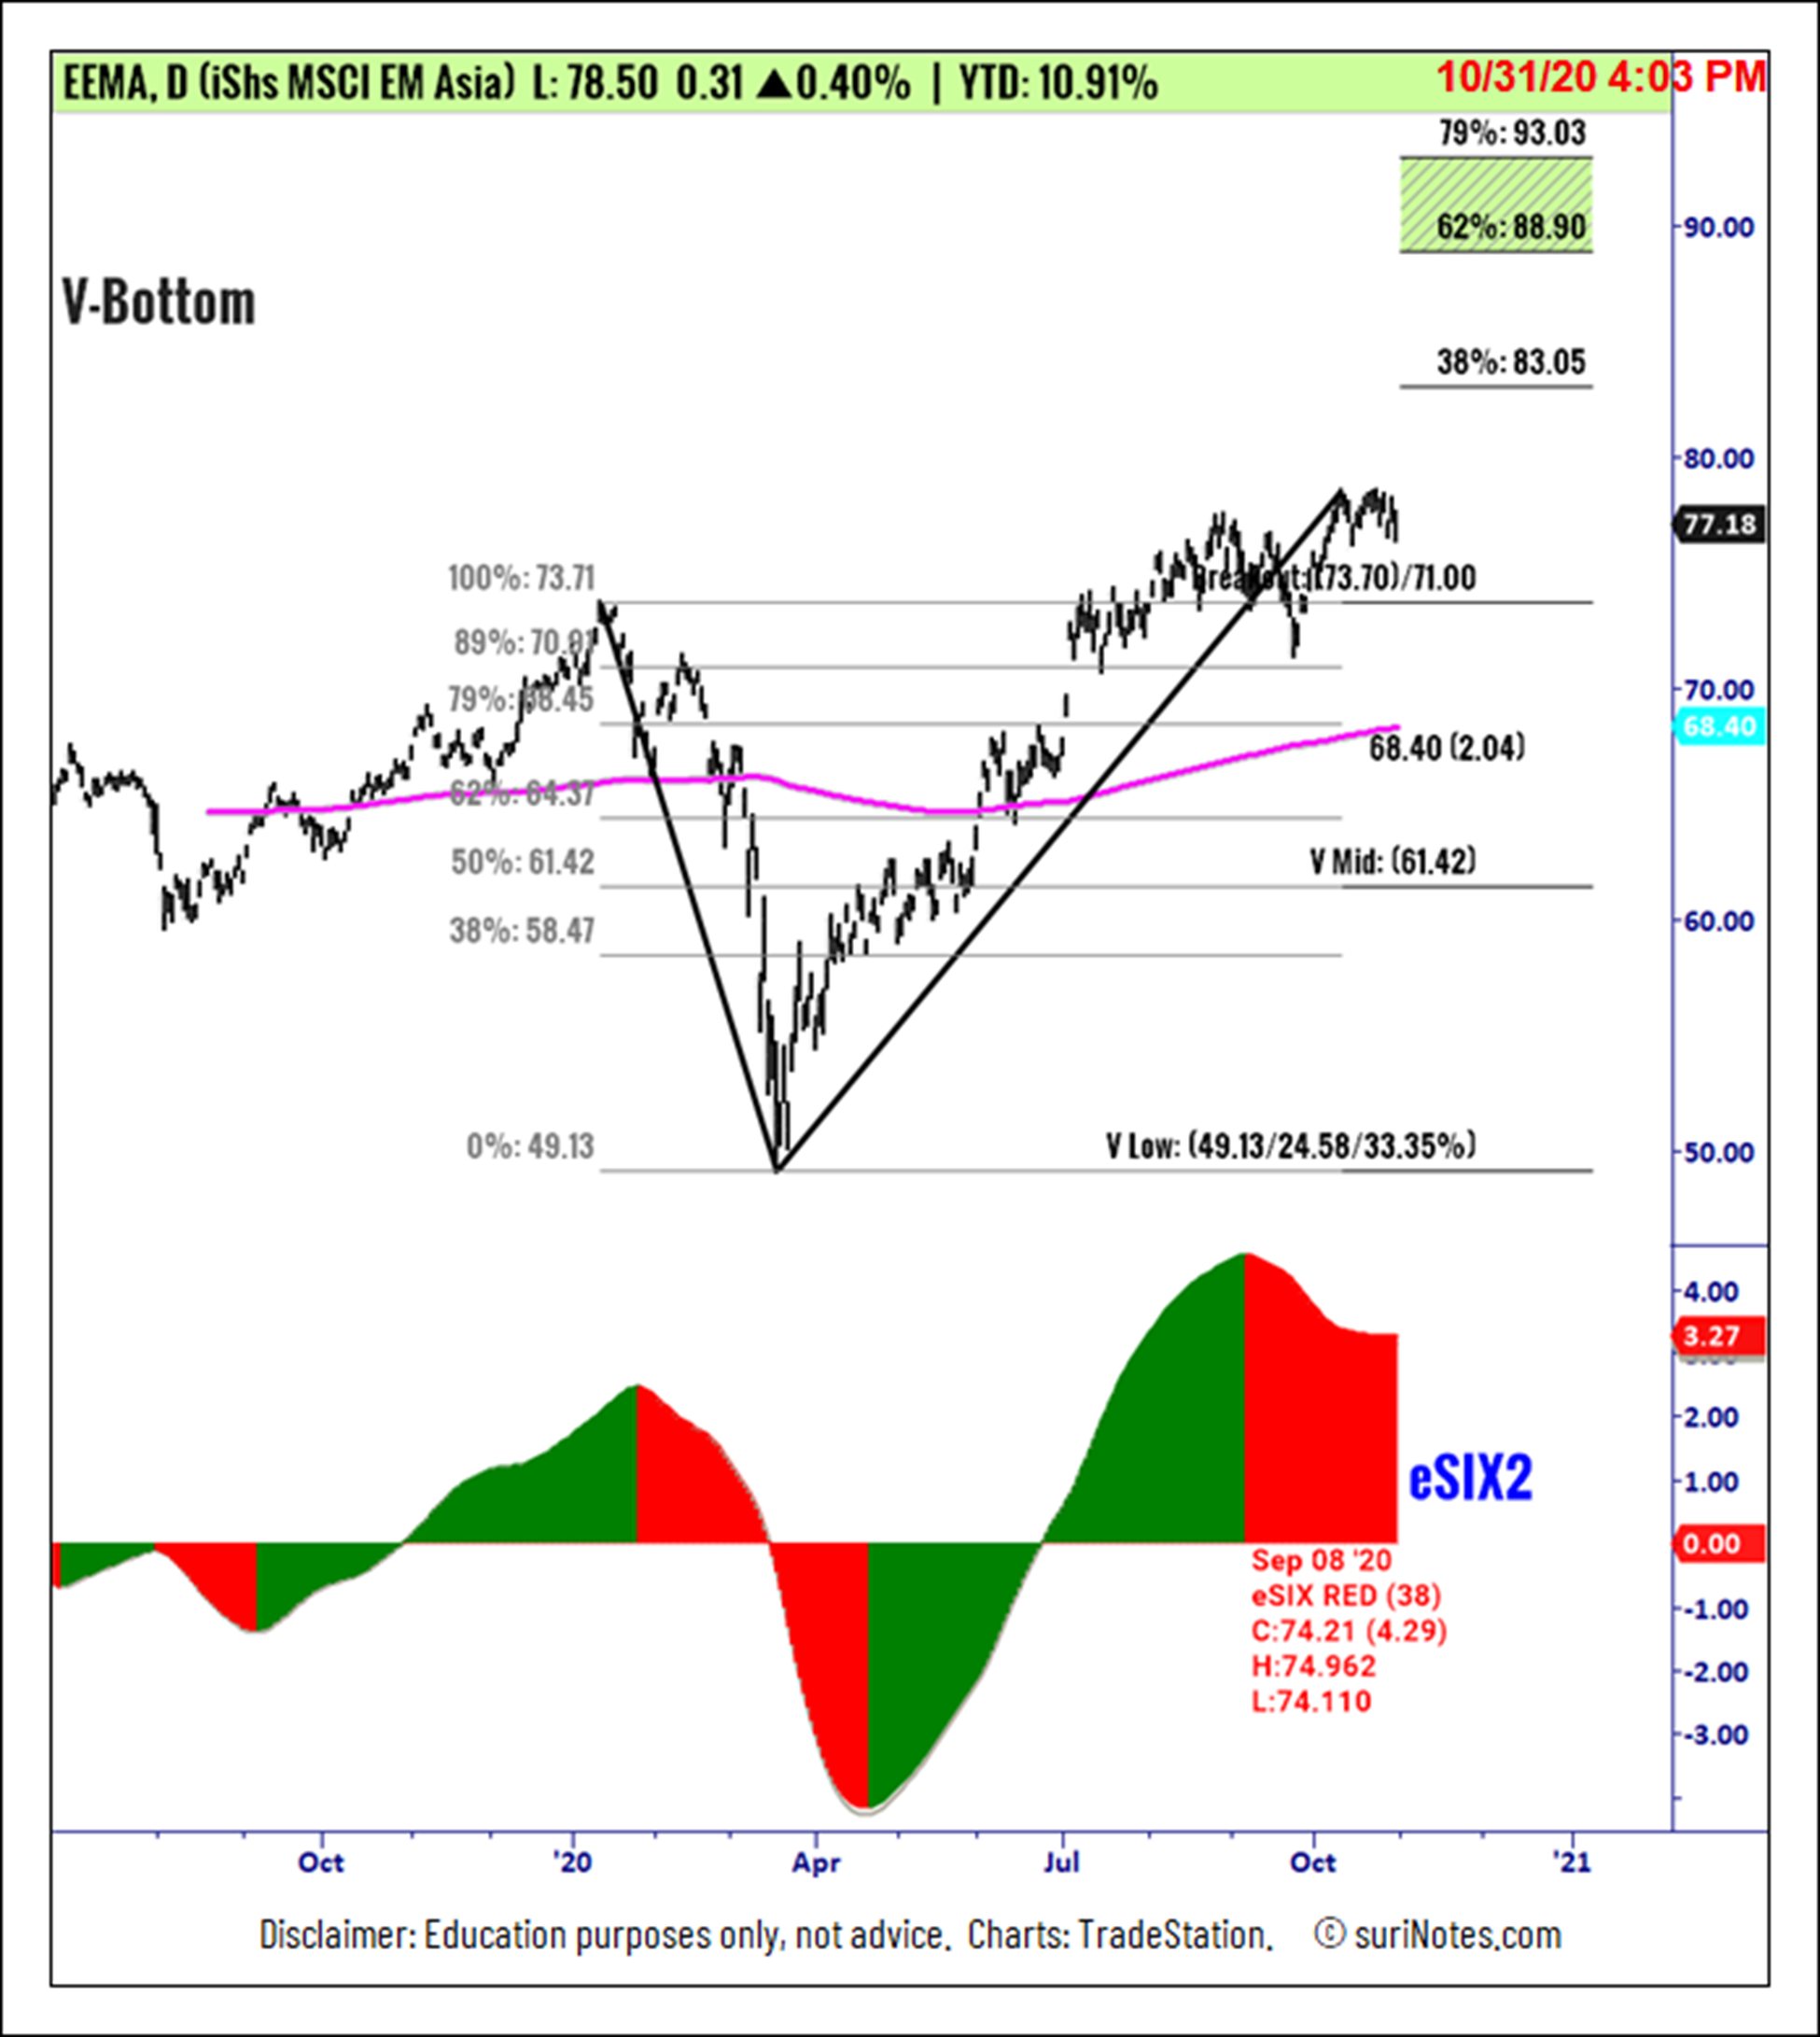
iSharess MSCI EM Asia ETF (EEMA) is forming a V-bottom pattern on its daily chart and trading near the breakout level of $73.81. V-bottom patterns are traded when price closes above the breakout level. A stop is placed below the mid-level of the V-bottom pattern at $61.42 or the recent pivot low. Targets are placed at $88.90 to $93.00.
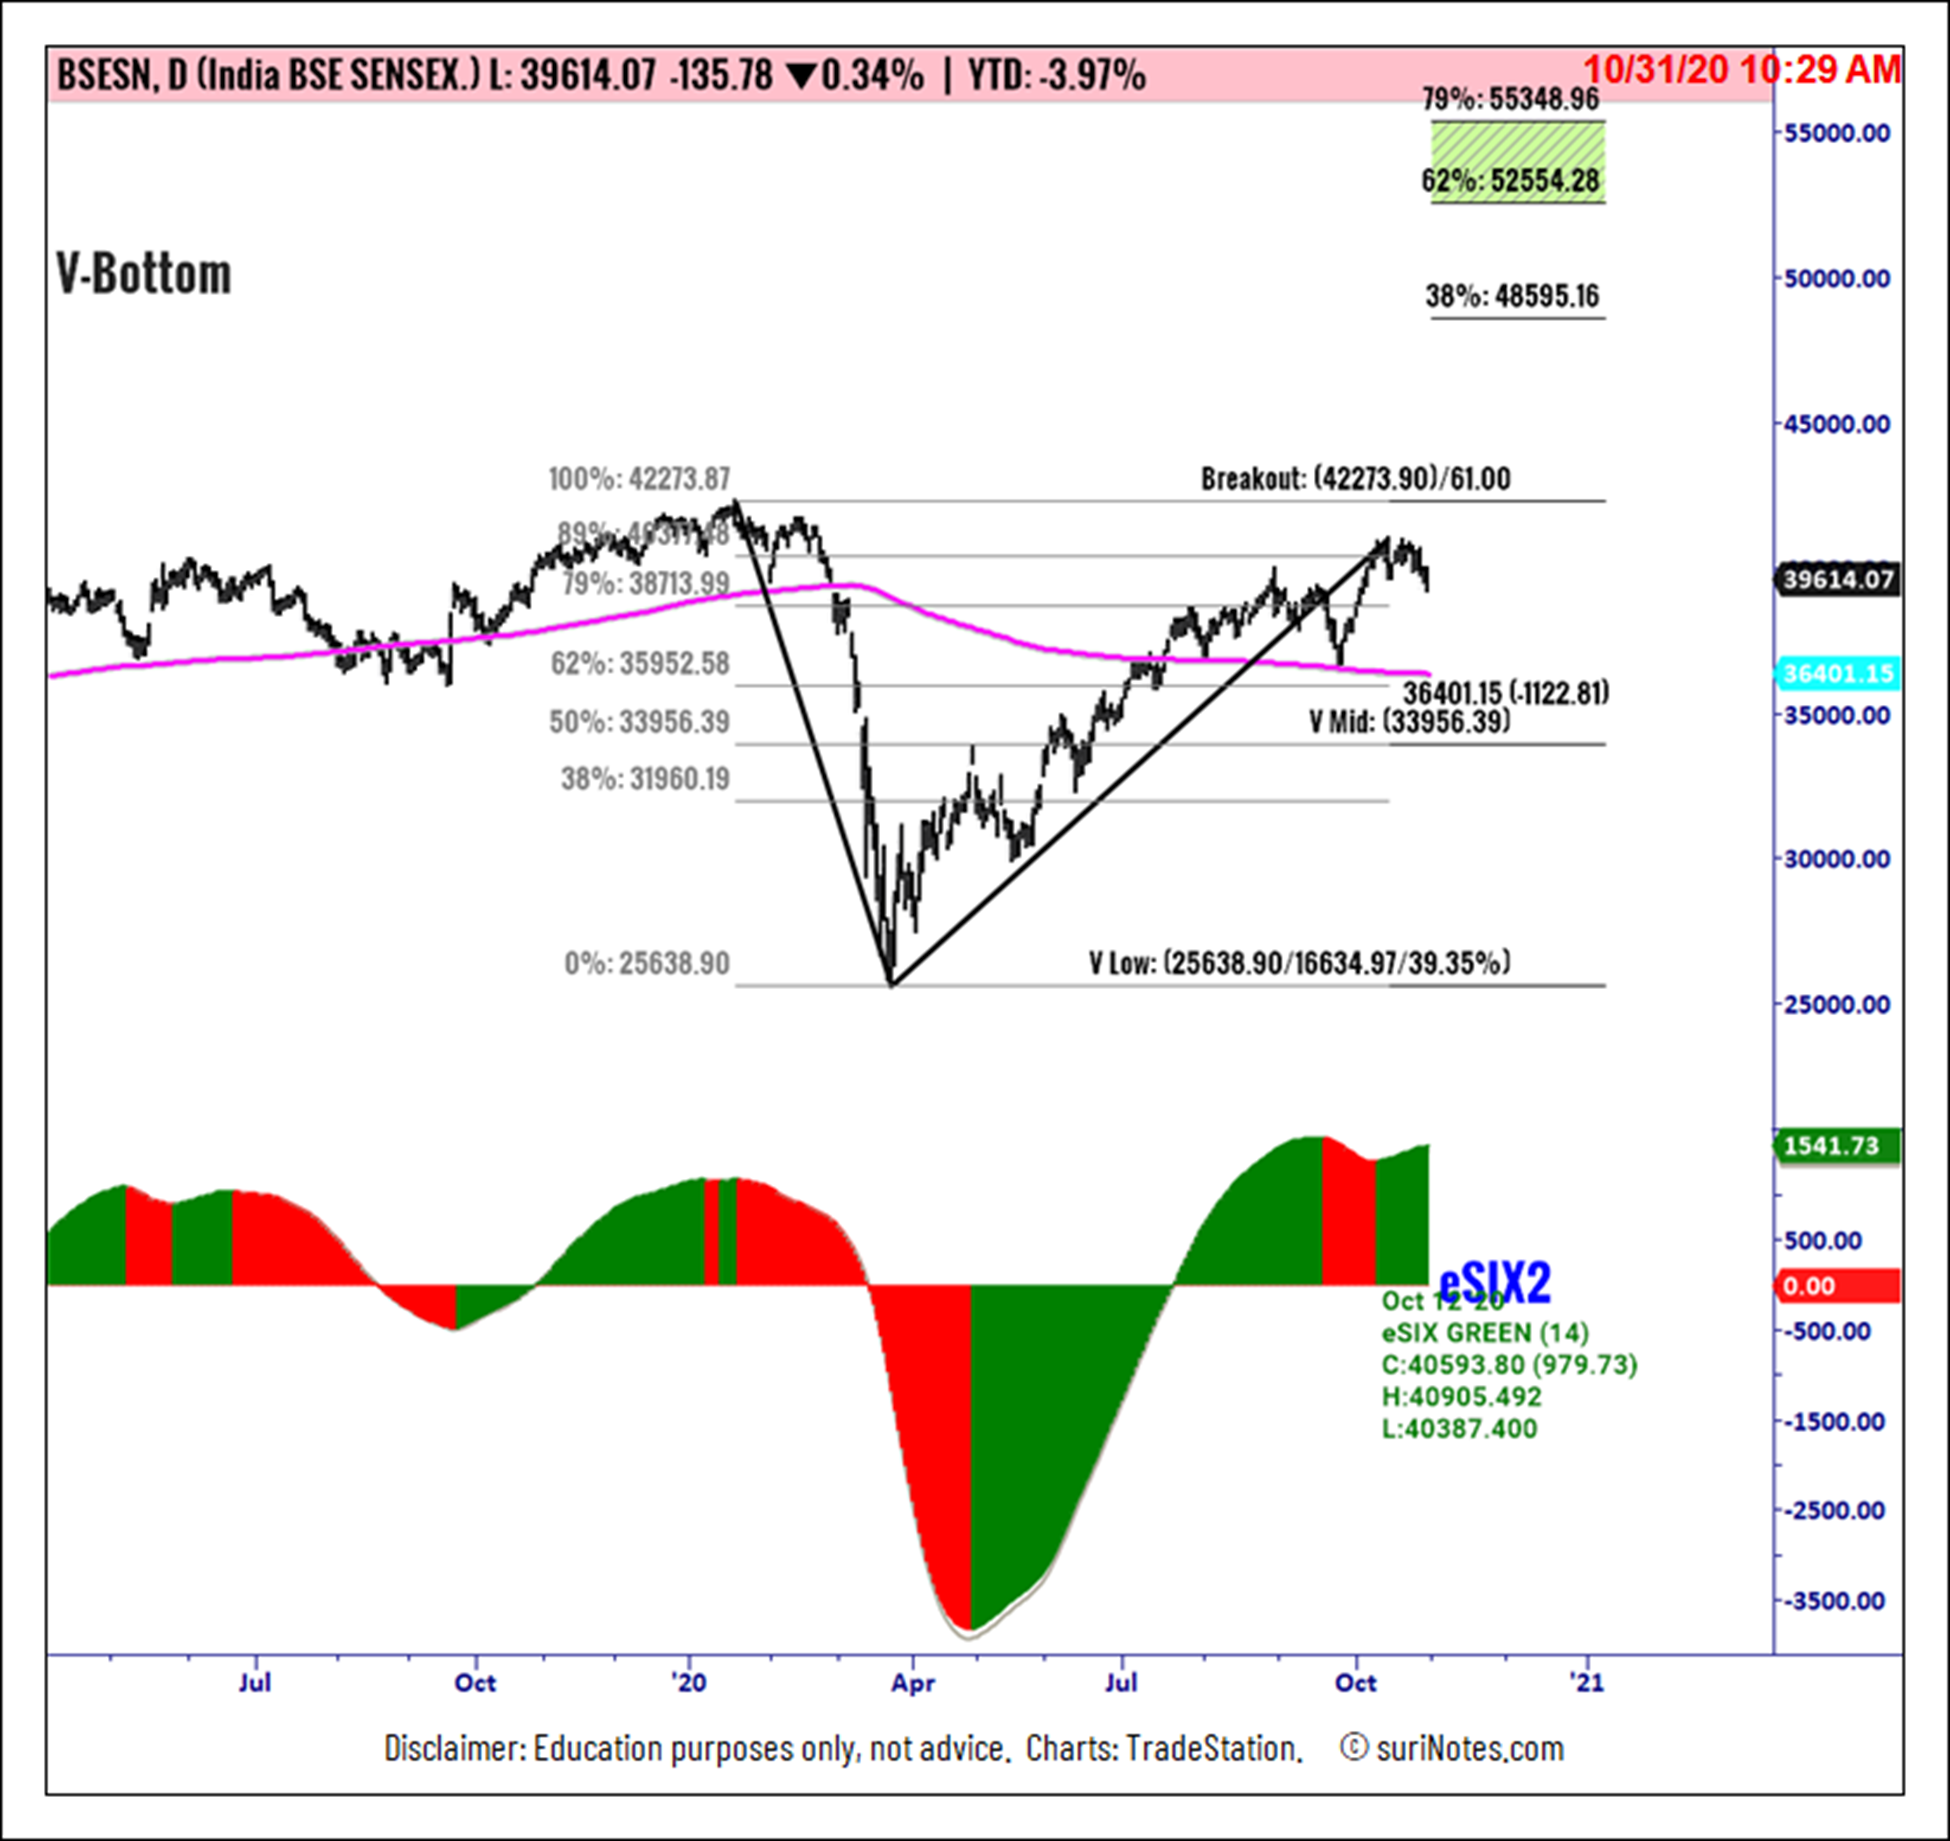
BSE's Sensex index (SENSEX) is forming a V-bottom pattern on its daily chart and trading below the breakout level of $42273.97. V-bottom patterns are traded when price closes above the breakout level. A stop is placed below the mid-level of the V-bottom pattern at $33956.39 or the recent pivot low. Targets are placed at $52554.3 to $55349.0
To learn more about Suri Duddella, please visit SuriNotes.com.


