
As I've discussed ad nauseum, the stock market is at its first, second or third highest valuation in history, depending on which metric you use, cautions Jack Adamo, editor of Insiders Plus.
I've also expressed a certain amount of concern that the market could continue to head north, leaving us behind, based on two quarters of solid, real, earnings growth and sentiment near all-time highs after breaking the losing streak of six quarters of lower earnings.
While market tops always occur near or at all-time highs in sentiment readings, those tops and that sentiment can stay up there for longer than we can anticipate.
I foolishly started shorting the market in late 2006 because I knew it was in a bubble and wouldn't end well. However, I finally had to stop the bleeding and cover the shorts. History shows that's often the case.
If we had held our short positions another year we'd have seen the market moving in our favor, and we'd have eventually made money on the shorts, but who has that kind of courage? Even the legendary Julian Robertson of Tiger Asset Management threw in the towel and quit the business during the tech bubble.
Since our bitter lesson, I've occasionally made short, tactical forays into shorting, while putting a stop loss in place. We've closed out all of those positions with small losses, so I'm not taking us there again.
Still, I want to remind you that, regardless of how seductive it may be, it is not a good idea to ride the current bull. To that end, I urge you to carefully view this chart.
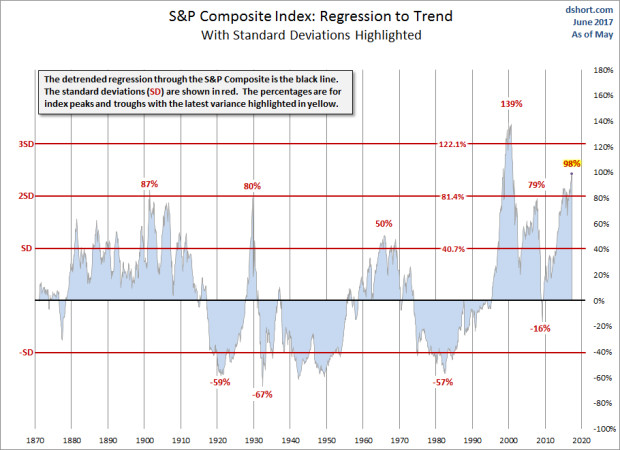
The above chart shows the variance in stock prices from their price/earnings ratios for approximately the last 150 years. Variance is expressed in terms of standard deviations. I won't go into the math of this; you'll fall asleep.
All you need to know is that the black line through the center of the chart is the long-term trendline and that markets inevitably return to trend.
Right now, the market is 98% above trend. It's only been somewhat close to this level three times in history, and has only exceeded it once; that was during the tech bubble when it reached 139% above trend.
In the crashes of 2000 and 2008, stocks on average lost about half their value. Many lost 80-90%, especially in the tech sector in 2000 and the financial sector in 2008.
One could argue, "So what; the market came back." It sounds like an okay argument on the face of it. However, after the tech crash it took 10 years to get back to breakeven, ignoring inflation. We got "even" from the 2008 crash in just 4 years, which sounds more tolerable.
The problem is that both recoveries, especially the second one, were driven by massive increases in the money supply and related measures, like quantitative easing. And it wasn't just in the U.S.; it was all over Europe, as well as China. Interest rates are now at levels that can do nothing except go negative if they're to create further stimulus.
It is my belief and the belief of the school of Austrian Economics, that this simply can't go on forever. Maybe I'm wrong, and earnings will grow to the point where P/Es become rational, or maybe the financial repression will continue forever and folks will be satisfied to pay ever higher prices for assets that give them real returns nowhere commensurate with their risk.
But I don't like the risk-to-reward ratio implied in this scenario. So, at the moment, I have no plans to increase our market exposure, except to the extent I may spot an occasional outlier in terms of value.
In the financial media you'll hear "experts" who will claim that this is a new paradigm for some reason or another: low interest rates, lower taxes, whatever. That has always been the cry at times like these when market prices cannot possibly be supported by rational evaluation.


