
The positive economic evidence and key technical indicators continue to support the outlook for further bull market gains; however, that does not rule out the possibility of a 5-10% correction in the months ahead, notes money manager and market historian, Jim Stack of InvesTech Research.
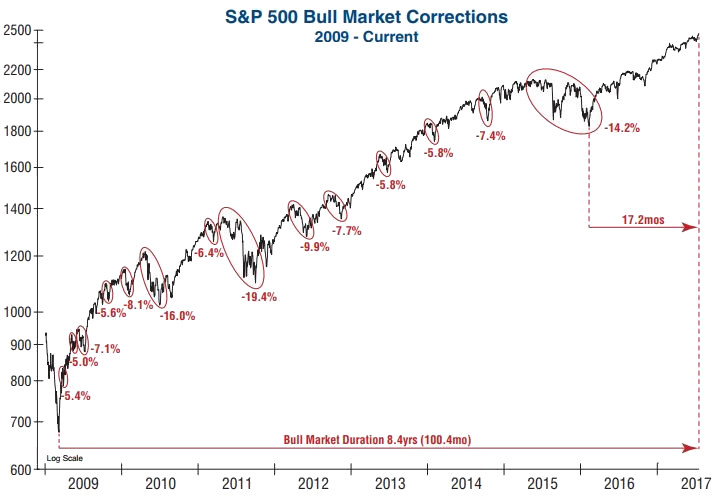
Corrections are a natural part of every bull market, and even in the current one there have been 14 declines of greater than 5%; these are shown in the graph below. These downturns have helped to rein in expectations and prevent investors from becoming overly enthusiastic.
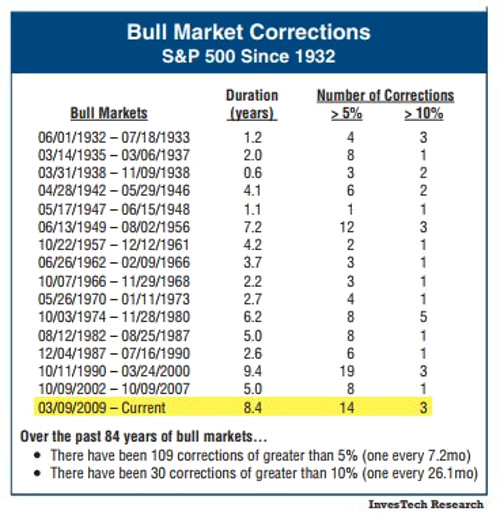
At this point, history suggests that the market is overdue for a pullback of 5% or more. As shown in the table below, corrections occur with regular frequency over the course of all bull markets.
On average, a 5% correction occurs about every 7.2 months and a 10% correction might be expected at least once every 26.1 months.
The current "correction-less" period is by far the longest of this bull market at 17.2 months. There was a 4.8% decline that ended prior to the election in 2016, but even if it had surpassed the 5% threshold, the market would already be due for another one.
It also seems likely that a correction could occur within this seasonally weaker May-October period. Despite the impressive duration and gain of this current bull market, a 5% drawdown has occurred between May and October in every calendar year.
In several of those years (2010, 2011, and 2016), this 5% decline occurred within a larger correction that began before May, but in all eight years the S&P 500 experienced a loss of at least 5% at some point during the weaker seasonal time frame. Odds are that this year will be no different.


