
At the top of the economic cycle, the volatility index drops to record lows, cautions Dennis Slothower, economic and market forecaster and editor of Outsider Club.
This drop in volatility occurs while unsuspecting investors become confident that prices will continue to rise and rise on the backs of supporting liquidity from the Federal Reserve or other sources. These people are often referred to as “dumb money.”
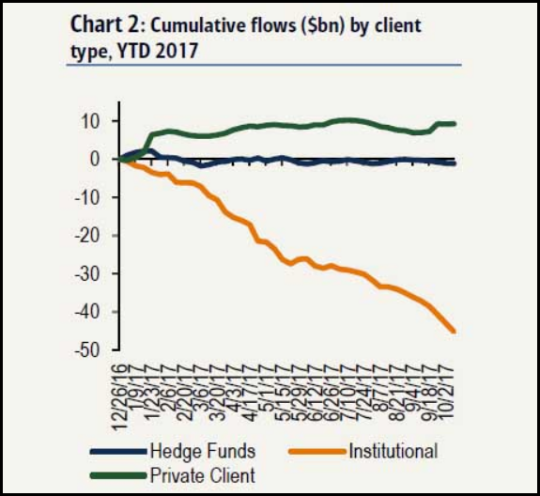
Then there are the institutional investors who realize that sometimes a good thing is too good to last. They often begin selling just when the public finally feels comfortable buying in “at the top.” This group of investors is often referred to as “smart money.”
Check out what the retail “dumb money” has been doing and what the “smart money” has been doing over the last year. Even with the many record highs being set, the smart money is convinced that the right approach is to lighten up its equity allocation:
Another way to look at this is to compare the Economic Policy “uncertainty” against the Equity “uncertainty”, i.e., similar to the volatility index.
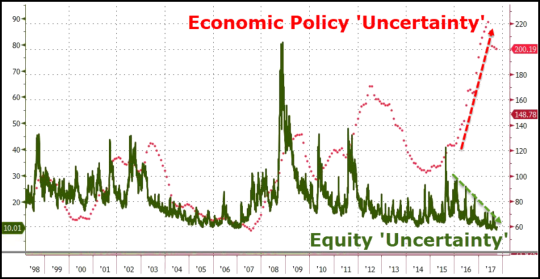
There are two important distinctions on this chart I would like to draw your attention to. First is the enormous split between Economic Policy “uncertainty”, the red dashed line versus the Equity “uncertainty”, green line.
With Obamacare failing and tax reform the only possible major economic policy that might make it through Congress in 2017, it is clear that the many fiscal stimulus opportunities from the Trump administration have not made it through to the economy.
That is why the red line has spiked so high. We have repeatedly warned of this all year long. And despite the failure of successful fiscal policies being passed by Congress, the equity uncertainty continues at record low levels, much like we saw in 2006 and 2007, just ahead of the 2008 financial crisis.
These lines have traditionally paralleled each other throughout the last 20 years. The enormous divergence seen since 2016 is clear evidence of liquidity support from the world central banks to keep the markets looking safe while “smart money” unloads to “dumb money” as much as the dumb money is willing to grab and hold on to for as long as it is willing.
This divergence is in rare and extreme levels, the kind only seen ahead of strong market reversals and economic recessions. Don’t think it can happen? Just wait
The truth is corporate earnings aren’t really fueling the gains in the stock market and haven’t been excelling over the last couple of years in a way that justifies such extreme price levels.
Earnings since 2014 have been almost solely about oil prices without broad corporate earnings growth in the other sectors. This puts the stock market grossly out on a limb when you consider recent P/E ratios.
Take note of the Russell 2000 P/E ratio of 115.45 times earnings!. It just illustrates how bloated this market has become even as smaller companies continue to erode.
Overvaluations do not cause bear markets. What does cause bear markets is an inverted yield curve caused by several rate hikes by the Fed and, at some point soon, the stock market is going to discover it doesn’t have a growing economy to support price valuations. I have no idea what program trading machines can do when the switch finally gets turned against the market.


