

Since mid-October, I have been on the lookout for the market to top or make a multi-wave correction. The market did top in January and has formed an ABC retrace (three-wave correction). This report is a mix of both current market action and educational material on how stocks and commodities trend and move.
The question everyone is asking is: “Is this market topping out or is it just a bull market correction?”
Well of course no one really knows what is going to happen next. So the only way to make consistent profits in the market is to clearly understand the main technical analysis skills (chart patterns, trend lines, support and resistance, and volume). You must also understand how to manage your money and trades. I scale in and out of positions during key support and resistance levels to keep downside risk low.
One of the toughest parts of trading is trading discipline. If you cannot take losses easily, then trading is not for you. You must be able to exit a trade when your stop level has been reached or you think the trade is starting to go wrong. Holding onto losers will blow up your account very quickly.
Other than those key skills, all you can do is watch the charts and re-evaluate each time a new bar (candlestick) pops up on the chart. Remember to trade with the larger trend of the chart two to four times longer than your actual trading chart.
Example: If you trade the 30-minute chart for entering and exiting trades, then you should be watching the two-hour chart (120-minute chart) to understand the full picture.
Market Trends and Price Movement
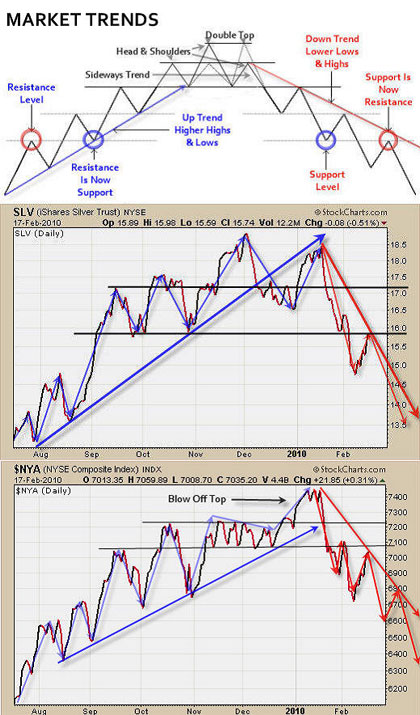
As we all know, when the market is trending up, we are seeing a series of higher highs and lows, and the reverse is true for a downtrend. We also know there are several different ways a market can top before reversing. The charts below show how the market generally moves on all time frames.
The market will top and bottom in one of four ways shown below:
1) Sideways Trend: A consolidation or triple top
2) Head and Shoulders: This is a great trading pattern
3) Double Top: Lower volume rally and sharp selling once high is reached
4) Blow-Off Top/Bottom: This is when volume spikes and the price moves quickly (great for panic trading)
Silver and NYSE Daily Trading Charts
Take a look at the charts below and you will see exactly how the market moves and where the market is currently trading.
Click to Enlarge
Trading Conclusion
In short, stocks and commodities were in rally mode for all of 2009. So far this year, prices have started to slide, forming some bearish looking charts. But it’s not the end of the world by any means. Depending what happens in the next one to three weeks, we should know if the market is back in rally mode or still in selloff mode.
I am somewhat neutral at the moment, and maybe a little bearish because from a technical standpoint, there are just as many arguments/technical analysis points for prices to move up as there are to move down. When I get in this situation, I just sit back and wait for a clearer picture before putting my money to work. Remember, when in doubt, stay out!
By Chris Vermeulen of www.GoldAndOilGuy.com


