Fibonacci analysis on the most recent daily chart for gold predicts that if the metal can continue higher through overhead resistance, a move toward the all-time high at $1900 could lie ahead.
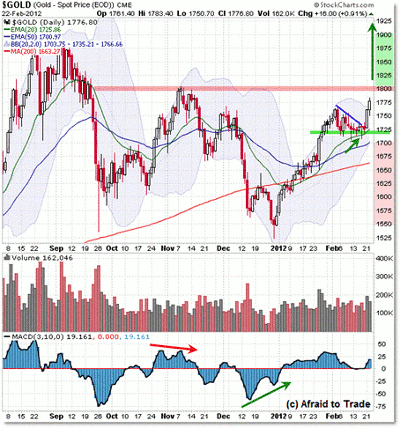
Let’s take a moment to view the daily chart for gold, paying close attention to this week’s successful test/rally off confluence support which now threatens a breakout above the initial resistance target.
On the daily structure, gold is officially in a short-term sideways trend with range boundaries between $1,600 (or even $1,550) as support and $1,800 as upper resistance.
Of course, the longer-term primary and intermediate trends remain bullish/uptrending in the higher-time-frame picture.
The key point to focus on currently is the recent support line (with multiple bullish reversal candles) at the rising 20-day exponential moving average (EMA) in February.
:One could say price formed and broke above a bull flag trend line, and price is currently in motion towards the minimum overhead price target at $1,800, which was the prior high from November 2011.
From a planning standpoint, if gold continues its upward movement and breaks firmly above the $1,800 boundary, then the next potential target opens up to $1,900—the all-time high from August/September 2011.
Ironically, these are also “round number” levels in addition to prior points of price reversal, thus making them important references.
That’s the current picture, but let’s take a look underneath price to see an additional support level from Fibonacci.
|pagebreak|This is a chart I posted on my site recently when discussing the potential buying opportunity this week, which so far has developed successfully.
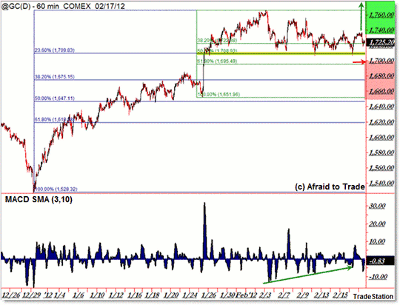
The main idea of this chart is to show two levels of Fibonacci retracement confluence as drawn at the $1,710 area (highlighted).
You can also see the three spike intraday reversals off this support confluence corresponding as well with daily reversal candles.
Going beyond the Fibonacci confluence at $1,710, I’m showing a positive momentum divergence throughout the month of February in the context of this support line.
From an objective standpoint, had gold moved this week under $1,700, it would have triggered a potential breakdown trade.
From the report to present, gold has already achieved its short-term upside target of a move back to the $1,760 level and is on to the higher target—as seen on the daily chart—at $1,800.
It should be very interesting to see whether gold continues its upward move and shatters the $1,800 prior resistance target, or if it takes a breather/pause (retracement) from its initial upside target.
By Corey Rosenbloom, CMT, trader and blogger, AfraidToTrade.com


