

A shift in the Stocks/Commodities ratio doesn’t necessarily mean the stock market goes down and the commodities index goes up. The two-price series often move in the same direction,
asserts Jack Crooks, President, Black Swan Capital.
Quotable
“The most difficult thing in markets is knowing how to wait for a big move that you know is going to come.”
—Woody Dorsey
Based on the Stocks/Commodities ratio chart we have been following and sharing for the last several years, it’s now time to start buying commodities, at least in a greater proportion to stocks.
Why? Well, because the Stocks/Commodities ration just made a round trip and interestingly even the timing is symmetrical. The visuals below should help explain….
It is rarely this simple and no-one rings a bell at the top or bottom.
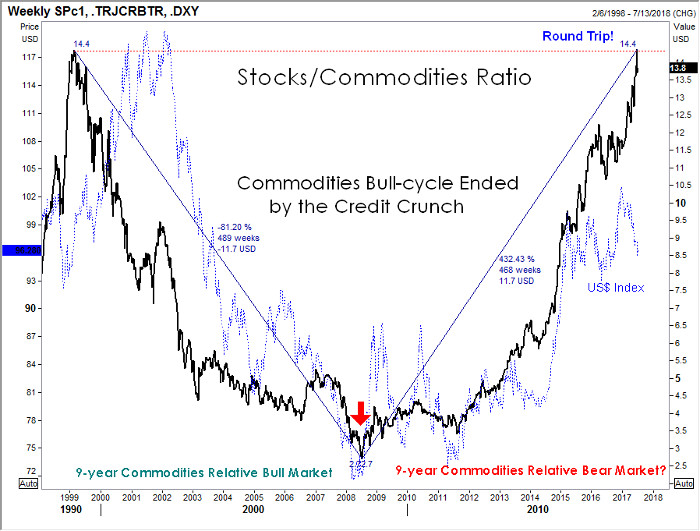
There are a lot of moving parts in the chart above. Here are the key points we perceive:
• A nine-year (489 weeks) relative bull market in commodities; i.e. commodities stronger than stocks, has been met now with a nine-year (468 weeks) relative bear market in commodities.
• The Stocks/Commodities Ratio (calculated by dividing the S&P 500 by the Thomson Reuters Commodities Index) peaked back in early 1999 at 14.4; and it has been almost exactly retraced back to 14.4—an eighteen-year round trip.
• We would suggest two drivers for the commodities bull move from 1999-2008: the symbiotic relationship between China’s huge demand for all things commodities to build stuff to support the massive US consumer demand funded by the belief debt was painless (aka one’s house became their personal ATM); and the weakening of the US dollar (blue dotted line on the chart) which pushed up the dollar price of real stuff (commodities). [Self-reinforcing circle; aka feedback loop.]
• The sea change event in the global economy has been the Credit Crunch; it triggered two events: 1. a new bull market in the US dollar; and 2. massive amount of liquidity to drive up financial assets as the things real lost investment appeal in a slow growth environment and became cheaper in US dollar terms. [Self-reinforcing circle; aka feedback loop.]
What might be some of the reasons we might see a reversal in this ratio, or put another way—what might make commodities relatively more attractive than they have been over the past nine years? A couple of inter-related rationales include:
• Global economic growth rebounds sharply. Already we are seeing a surprisingly strong recovery in Europe if the numbers can be believed. China, despite all the disaster scenarios, is keeping the balls in the air. Canada is improving. And despite having been declared “dead and buried,” the Trump Reflation trade could rise again.
• The US dollar enters a new bear market phase—the US dollar index topped in January and has looked quite sickly for months despite the fact for many of those months the Fed seemed as if it would be the only central bank in rate hike mode. Now we have the European, Canadian, and UK central banks in the game and the US dollar will likely give back its rising yield spread. Couple that with money flow potentially heading out to the commodity-based countries and you have the making of a big push lower in the dollar (thus bidding up dollar price of real goods as most are still denominated in US dollars).
We are deep in the realm of guesswork here and there are plenty of solid rationales to suggest this trend higher in the Stocks/Commodities ratio will continue. (Continued global deflation as the world struggles with too much supply capacity and the cold blanket of debt would be a good one.)
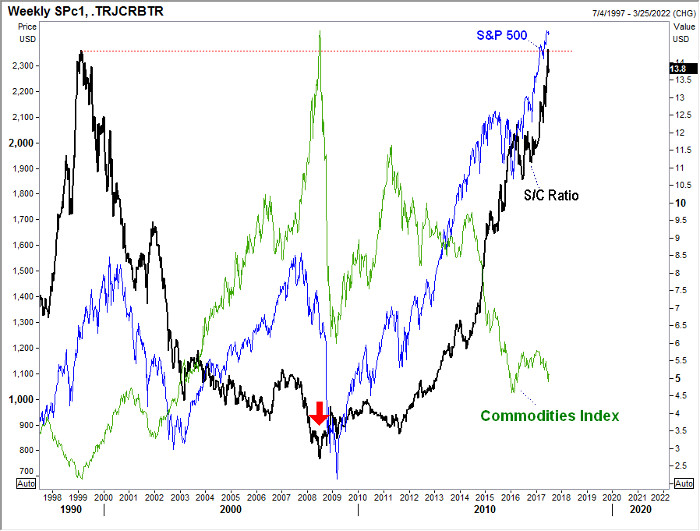
Also, keep in mind that a shift in the Stocks/Commodities ratio doesn’t necessarily mean the stock market goes down and the commodities index goes up. The two-price series often move in the same direction.
For the S/C ratio to turn down from here, it means the commodities index is rising faster than the stock index—that is all. In the chart following, I have overlaid the S&P 500 Index and Commodities Index over the S/C ratio so you can see these relationships.
The trend is your friend until it’s not, as they say. But given the incredible symmetry in this ratio alone, it may be time to start looking in the other direction, even if it’s too early to act.
Subscribe to Currency Currents, a free global-macro and market newsletter here…


