The larger signals are pointing to a strong rally setting up within the next few weeks and that is what you should focus on. Any lower low–if we get it–should be a buying opportunity, asserts Avi Gilburt.
While I would love to suggest that we have begun the next larger degree rally already, the market has not provided me with strong indications that is going to be the case just yet. There are many indications that the market may have already bottomed, yet there are just as many indications that we may see the dreaded one more lower low before a lasting bottom may be seen.
I believe an investor should be preparing now for an impending rally which will likely take hold over the coming weeks.
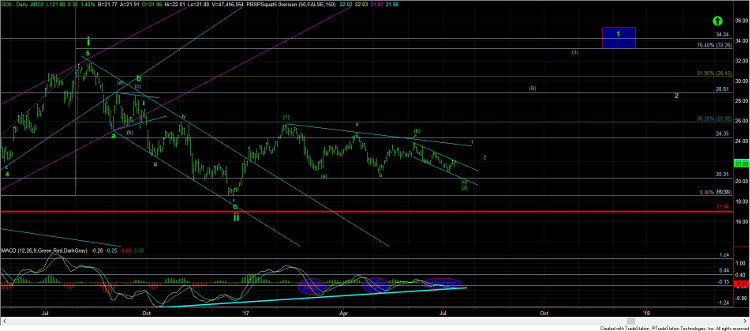
Now, whether we see that lower low or not, I want to highlight something of which you should definitely take notice, especially if you are bearish this complex. Please take a look at the daily Market Vectors Gold Miners ETF (GDX) chart below.
If you review the MACD histogram on the bottom, I have highlighted each of the 3 declines since we struck the high of the year back in February 2017. Notice how each decline has taken place on weakening downside technicals. This shows clear evidence of waning sellers, as the selling has almost been completely exhausted.
While we still can see one more drop to “fake-out” those who have their stops just under 20.89, I believe this chart provides strong evidence of us being on the cusp of a very strong rally. In fact, if you review the bottoming histogram into late 2016, we saw the exact same evidence of waning selling, which led to the strong rally seen off the December low.
Additionally, our management team of our EWT Miners Portfolio took the opportunity to review many of the leading miners we track, and I have to note they are almost all looking ripe for a strong rally. We are seeing the same evidence of completing corrective pullbacks, along with the positive divergences one would normally see within a bottoming phase. So, the individual stocks are clearly supporting our larger overall perspective in the complex.
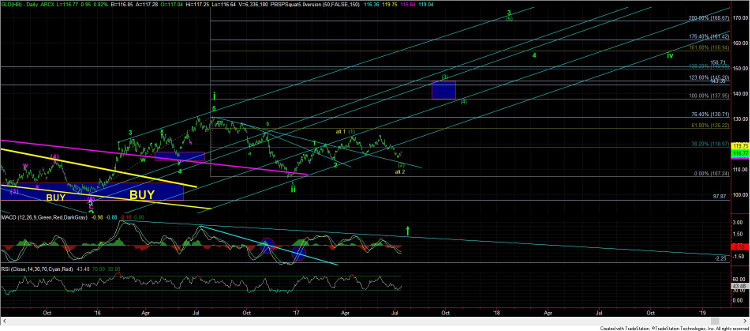
As far as the SPDR Gold Trust ETF (GLD) is concerned, it too can sustain a lower low, and would provide a strong positive divergence should the market drop below this past week’s price low. Again, this is supportive of the waning selling in the GLD, which usually portends the strong reversal to the upside that we expect. Moreover, this chart has been holding up quite strongly all year and the technicals are clearly supporting our larger expectations.
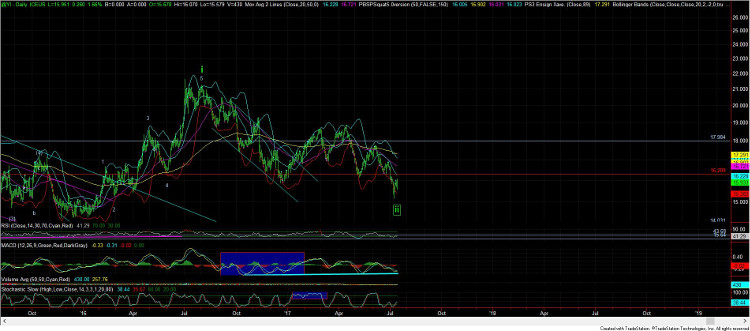
This leads me back to the problem child–silver. As I noted last week, silver is the chart which causes me the greatest amount of angst. If we do see that lower low in silver, it is possible it can extend to a low below the one struck in December 2015. That would then start us out on a new upside count into the bull market we are expecting. And, at the end of the day, I don’t think that would be such a bad thing.
But, since we counted the pattern off the 2015 low as a leading diagonal, my primary expectation is that we will not break below the 2015 low. You see, leading diagonals are known for their deep wave 2 retracements, which then lead to a powerful start of their ensuing 3rd waves. So, it is quite reasonable to expect silver to “catch up” after it completes this pullback, if it has not done so already.
As it stands as of the end of the day on Friday (July 14), I cannot say that I have clear evidence that the complex has certainly bottomed. Should we see a sustained rally in the GDX through the 22.60 region, then I could be convinced the bottom has been struck.
However, for the reasons I explained in detail in our trading room at Elliottwavetrader.net this past week, I think the probabilities still marginally remain on the side of the lower low to come, but it is not something for which I would aggressively trade. My ideal target for that lower low is the 20.31 region, and if you remember back several months, that was my original ideal target for the bottom for a wave (2).
But, the patterns are simply not clear enough on the microstructures to be certain that a lower low will, in fact, be struck.
The larger signals are pointing to a strong rally setting up within the next few weeks and that is what you should be focused upon, in my humble opinion. Any lower low–if we get it–should be a buying opportunity.
See charts illustrating the wave counts on the GDX, GLD, and Silver Futures (YI).
Subscribe to Elliott Wave Trader here